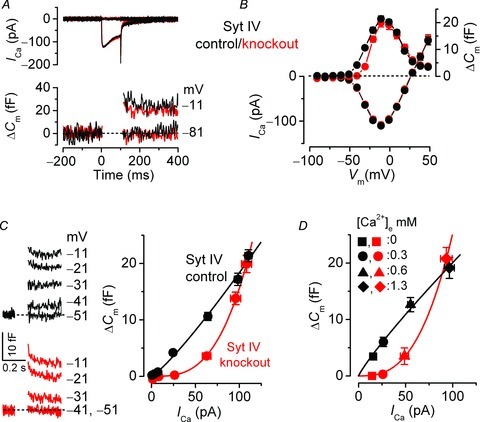
Figure 9. Calcium dependence of neurotransmitter release in adult IHCs from control and Syt IV knockout mice.

A and B, Ca2+ current (ICa) and changes in membrane capacitance (ΔCm) from adult IHCs in response to voltage steps, in 10 mV increments, from the holding potential of −81 mV. Extracellular Ca2+ concentration, 1.3 mm. In A, only peak responses and those at −81 mV are shown. C, left panels show average ΔCm traces from control and knockout IHCs; right panel shows the synaptic transfer curves obtained by plotting ΔCm against ICa for voltage steps between −71 and −11 mV (B). Fits are according to eqn (1) (see Fig. 8). D, synaptic transfer curves, similar to those shown in C, but obtained by plotting the maximal ICa and ΔCm values during the application of different extracellular Ca2+ concentrations. Figure modified from Johnson et al. (2010).
