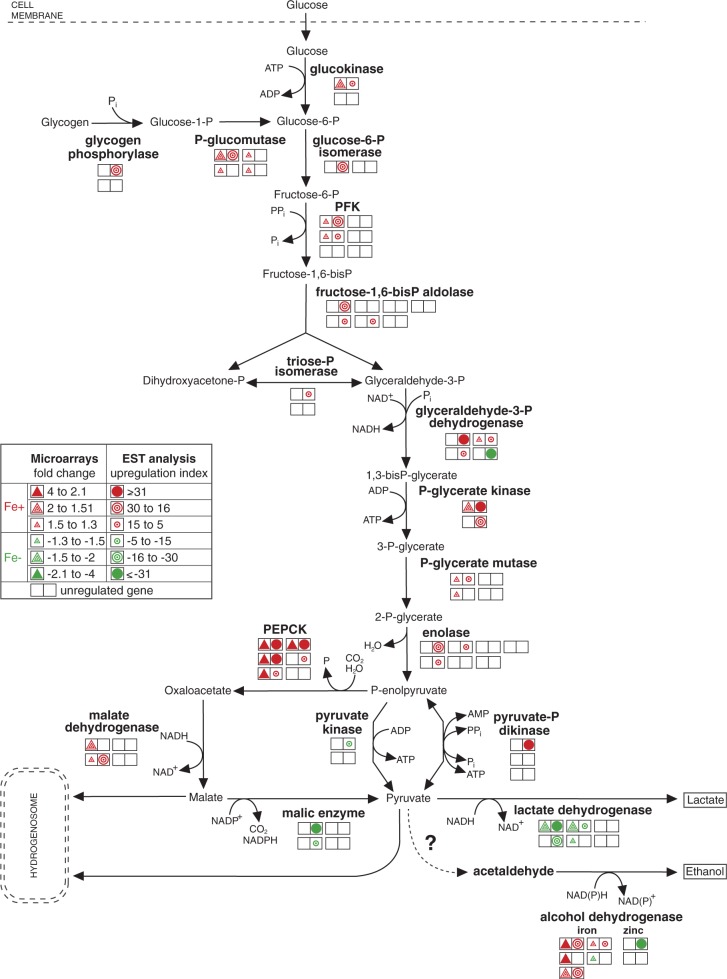
Fig. 3.—
Iron-dependent regulation of genes encoding enzymes in glycolytic pathway. Each double square represents a single gene copy. Triangles represent the results of the microarray analysis, and circles represent the results of the EST analysis. Upregulation under +Fe and −Fe conditions is indicated by red and green colors, respectively. The empty squares represent detected, but unregulated gene copies.

