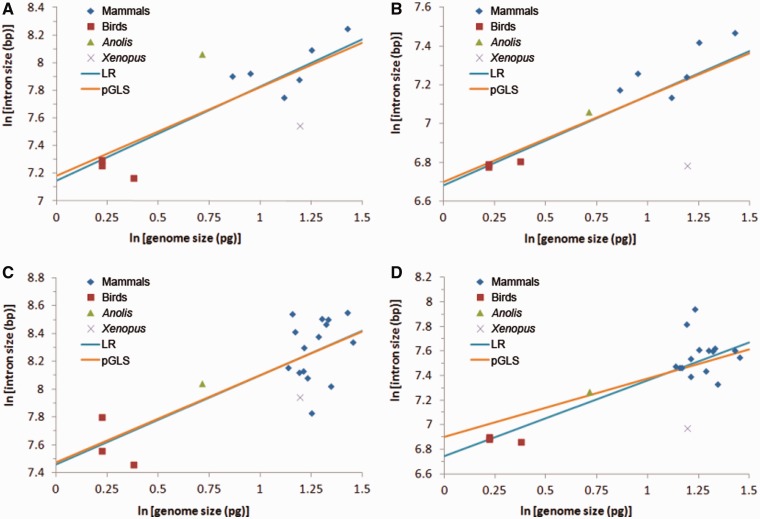
Fig. 4.—
Correlation between genome size and intron size. Light-blue lines indicate regression lines derived from normal linear regression model; and brown lines indicate regression lines derived from PGLS model, which accounts for nonindependence among data points. (A) Median size of first introns in data set A; (B) median size of other introns (introns except first introns) in data set A; (C) median size of first introns in data set B; and (D) median size of other introns (introns except first introns) in data set B.

