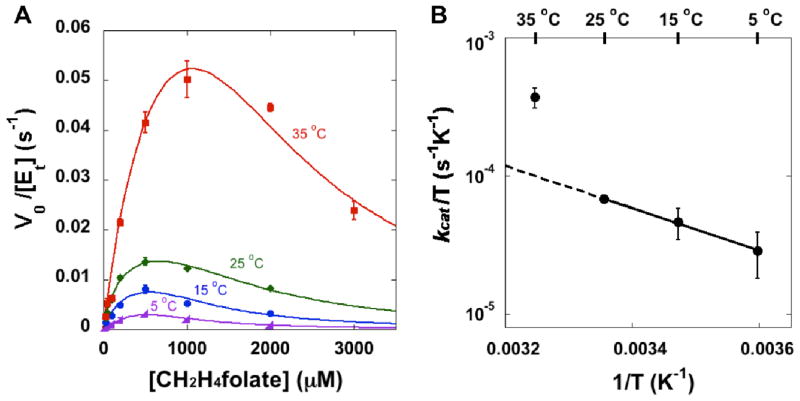
Figure 1.
(A) Steady-state initial velocities of Y209W ecTSase vs. the concentration of CH2H4folate at 200 μM dUMP. At each temperature, the data were fit to Eq. 1 by least-squares nonlinear regression. For clarity purpose, this figure only shows the average with standard deviation for each data point, although all the measurements (at least triplicates for each point) were used in the nonlinear regression for each temperature. (B) The Eyring plot of kcat is in accordance with a change in the rate-limiting step above 25 °C (see text).

