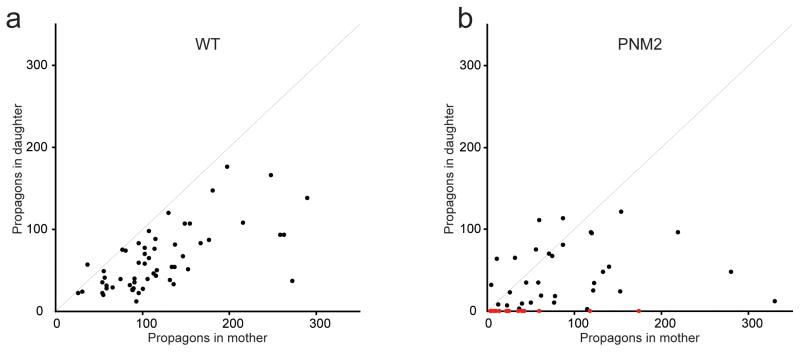
Figure 6. PNM2 in the Sc4 conformation shows a defect in partitioning.
The number of propagons in the daughter was plotted against number of propagons in the mothers for both WT (a) and PNM2 (b) [PSI+]Sc4 backgrounds. Red dots represent mother/daughter pairs in which the mother contained propagons, but the daughter did not.

