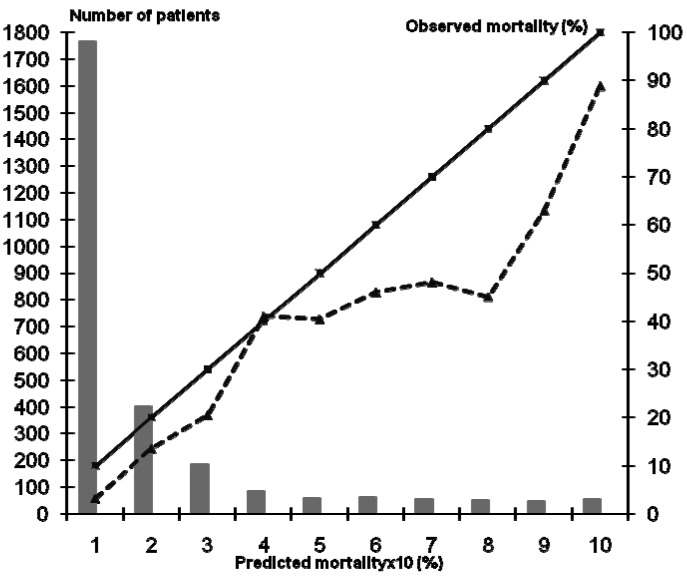
Figure 2.
Calibration curve for the Simplified Acute Physiology Score II. The solid line represents a perfect correspondence between the observed and predicted mortality; the dotted line represents the observed vs predicted mortality; columns show the distribution of the patients in the analyzed groups.

