
Fig. 2. Changes in gene expression after addition of spermidine or spermine.
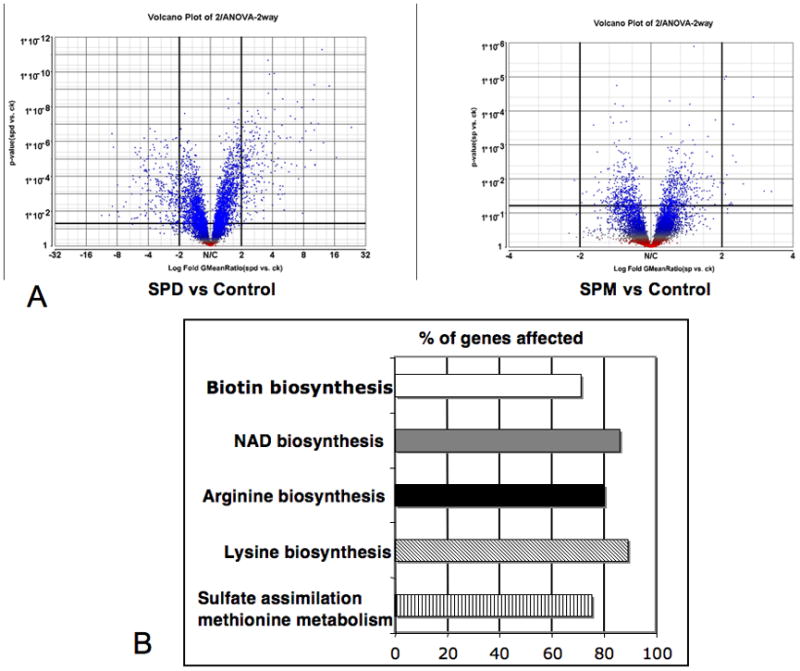
A. Volcanic plots depicting p-values obtained from a two-way ANOVA on the y-axis and fold change on the x-axis of either spermidine (SPD, left panel) or spermine (SPM, right panel) treated cells compared to control. B. Top 5 enriched gene ontology categories (p<0.001) showing the major metabolic pathways induced by spermidine. The graph shows the percentage of genes affected out of a total within each functional category.