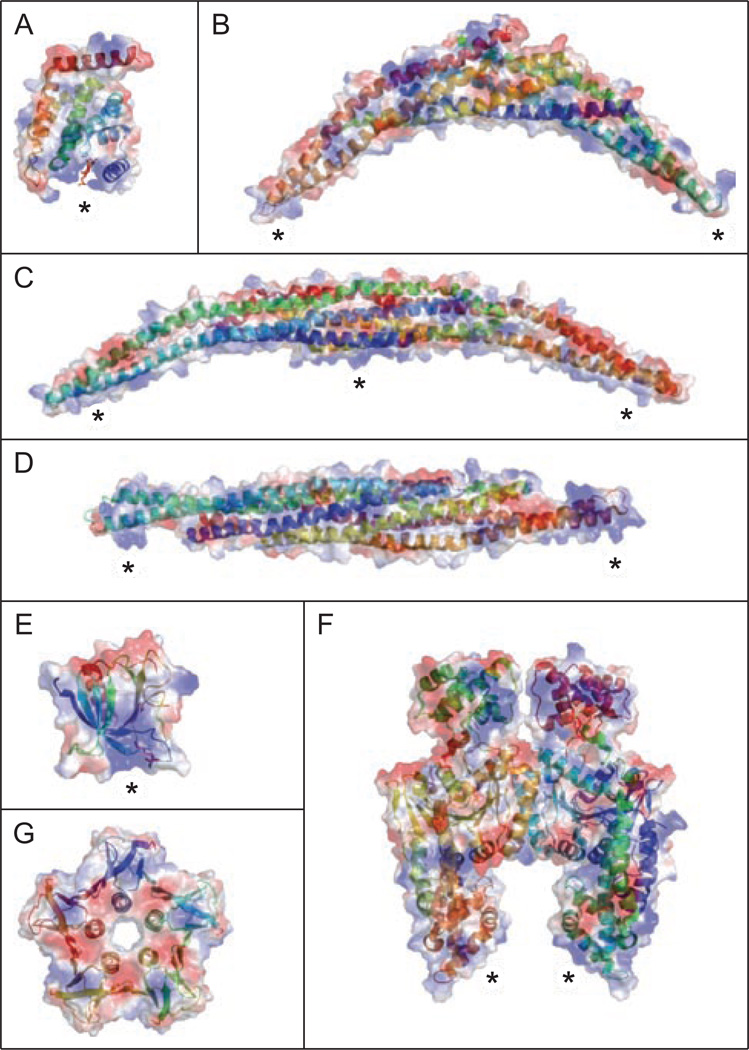
Figure 3.
Crystal structures of membrane bending proteins. Electrostatic surface of each domain with blue and red regions indicating positive and negative patches, respectively. Within each surface structure is the sequence in ribbon format, color coded based on distance from the N-terminus. Each domain contains positive patches that are potential lipid binding sites (marked with *). (A) ENTH domain from epsin with Ins(1,4,5)P3 bound to a positively charged surface (Ford et al., 2002). (B) Traditional BAR domain from Arfactin (Tarricone et al., 2001). (C) F-BAR from Cdc42-interacting protein 4 (Shimada et al., 2007). (D) I-BAR from IRSp53 (Millard et al., 2005). (E) PH domain from dynamin (Ferguson et al., 1994). (F) EHD2 (Daumke et al., 2007). (G) Shiga-like toxin I B subunit (pdb ID:1czg). A color version of this figure is available online.

