
Fig. 4.
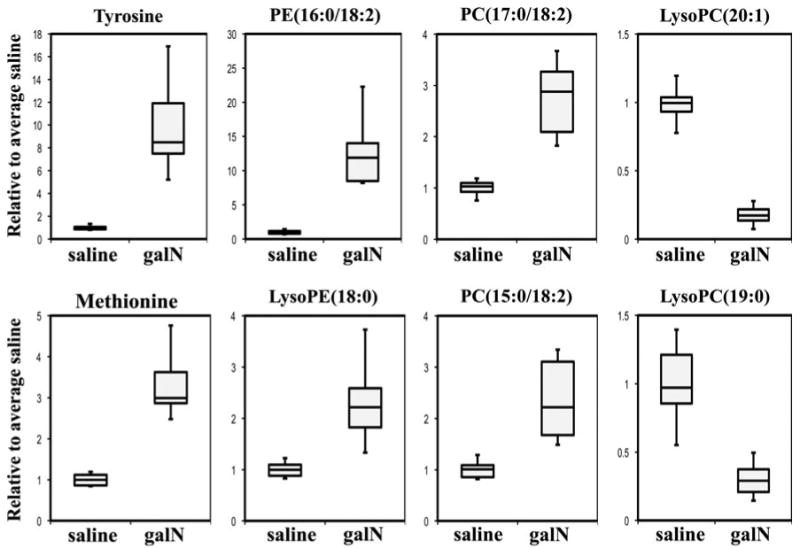
Representative serum metabolites significantly altered by galN-induced acute liver injury. Examples of metabolites showing high correlation with CDS score are represented by box plots. For the box plots the top and bottom of the boxes represent the 75th and 25th percentile, respectively. The top and bottom bars (whiskers) represent the entire spread of the data points for the animals. The hyphen indicates the median value. The y-axis is the level of metabolite relative to the average of the level of that metabolite in serum of saline-treated animals