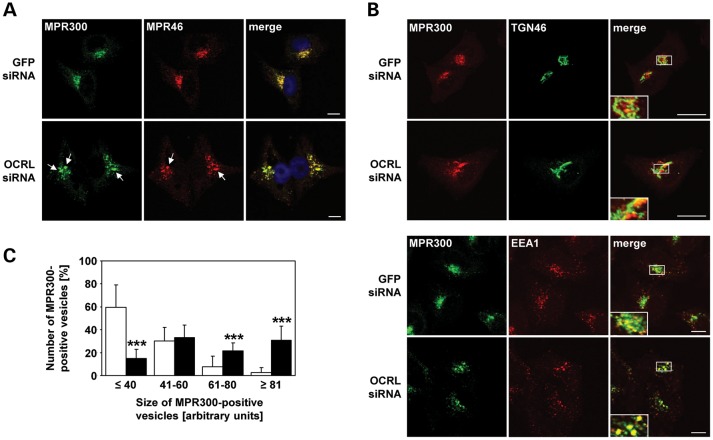
Figure 3.
MPR46 and MPR300 colocalize in enlarged endosomal vesicles in the perinuclear region in OCRL-depleted cells. (A–C) HeLa cells were treated with OCRL- or GFP-specific siRNA for 72 h, labelled with antibodies (see below) and analyzed by confocal laser scanning microscopy. (A) RNAi-treated HeLa cells were stained with an anti-MPR300 antibody, followed by an AlexaFluor488-conjugated secondary antibody (green), and an anti-MPR46 antibody, followed by an AlexaFluor546-conjugated secondary antibody (red). Co-localization of the two MPRs is shown on the merged images. The nucleus was visualized with DAPI (blue). Arrows point to enlarged MPR-positive vesicles. Scale bar = 10 µm. To exclude off-target effects, three different siRNAs against OCRL were independently applied. (B) RNAi-treated HeLa cells were stained with an anti-MPR300 antibody, followed by an AlexaFluor488- (green) or AlexaFluor546- (red) conjugated secondary antibody, and an anti-TGN46 antibody, followed by an AlexaFluor488-conjugated secondary antibody (green) or an anti-EEA1 antibody, followed by an AlexaFluor546-conjugated antibody (red). Co-localization is shown on the merged images. Scale bar = 10 µm. (C) Quantification of MPR300-positive vesicles of various sizes was performed by the Metamorph software. To enable direct comparison, all images were taken under the same magnification and laser intensity settings. Sizes of MPR300-positive structures are given in arbitrary units (AU). The number of MPR300-decorated vesicles per AU (≤40, 41–60, 61–80 and ≥81) is given as percentage of the number of vesicles counted in total. Results are from three independent experiments with a total of 20 cells per condition counted, and are shown as the mean ± SD (white square GFP siRNA, black square OCRL siRNA). ***P < 0.001 (two-tailed Student's t-test).

