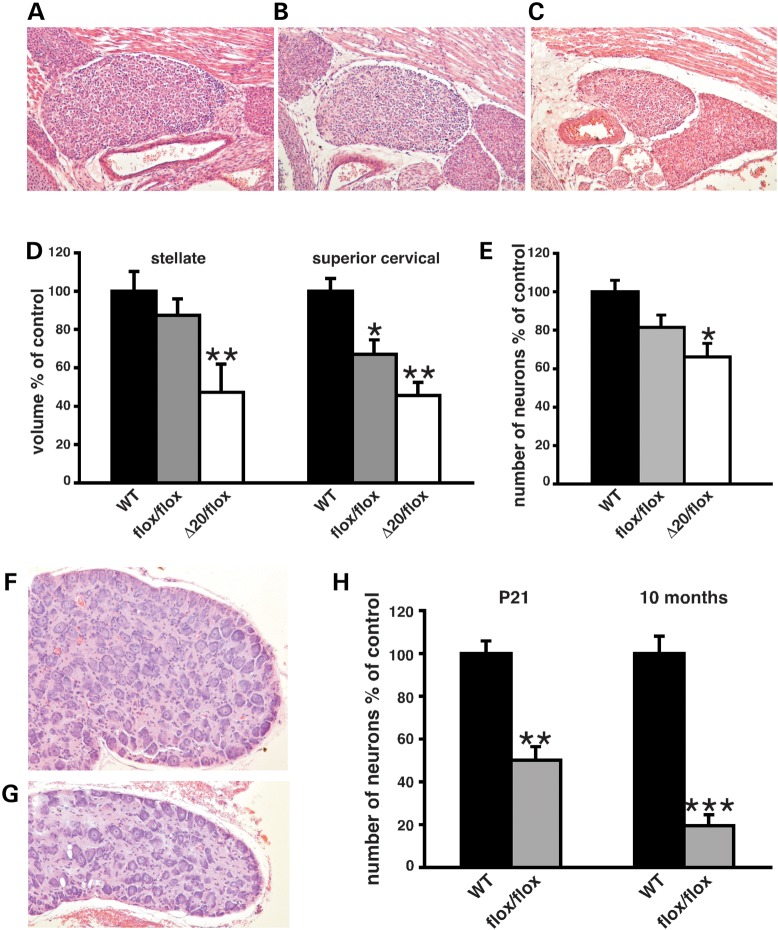
Figure 4.
Autonomic deficits in FD mouse models. (A–C) Representative coronal H&E-stained sections of SCGs of E18.5 WT (A), Ikbkapflox/flox (B) and IkbkapΔ20/flox (C) at their largest dimensions. (D) Volumes of E18.5 stellate and superior cervical sympathetic ganglia of WT, Ikbkapflox/flox and IkbkapΔ20/flox embryos, displayed as the percentage of controls (n = 3–5). (E) Neuronal counts of E18.5 SCGs of WT, Ikbkapflox/flox and IkbkapΔ20/flox embryos are displayed as percentages of controls (n = 3). (F and G) H&E-stained representative cross sections through SCGs of 10-month-old WT (F) and Ikbkapflox/flox (G) mice. Note the smaller size of the mutant SCG as well as the sparse distribution of neurons. (H) Neuronal counts of SCGs from P21 and 10-month-old WT and Ikbkapflox/flox mice are displayed as percentages of controls. Note that there is a significant decline in neuronal numbers from P21 to 10 months of age in Ikbkapflox/flox SCGs relative to controls (n = 3). Data are expressed as mean ± SD. *P < 0.05, **P < 0.01, ***P < 0.001.

