Figure 5.
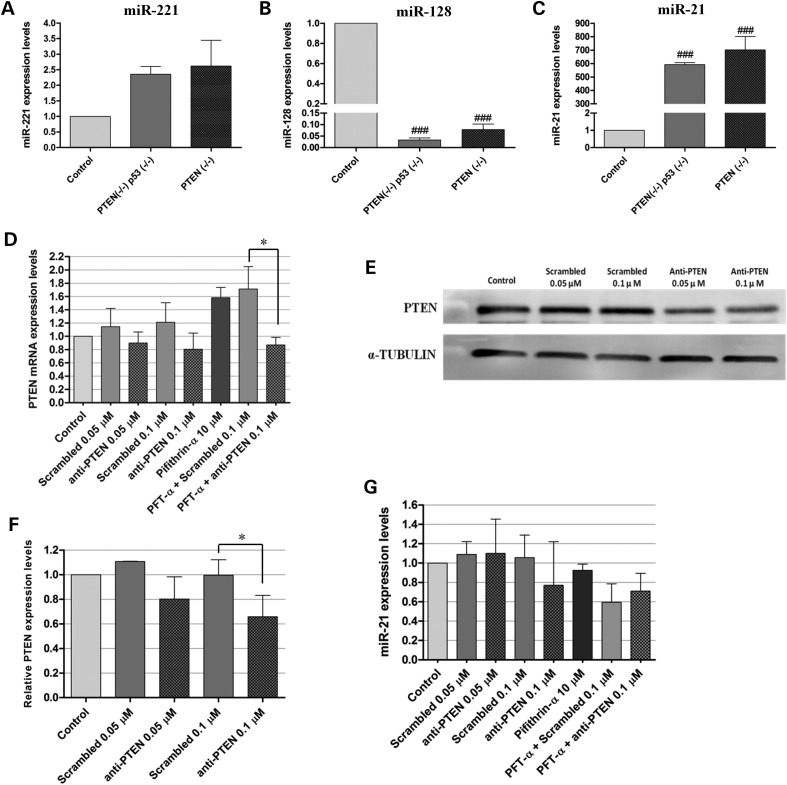
MiRNA-expression levels in primary cultures established from PDGF-B-driven mouse GBM tumor models and modulation of PTEN and p53 in U87-PDGF cells. (A) miR-221 (B) miR-128 and (C) miR-21-expression levels in PDGF-B-overexpressing double-floxed (PTEN−/−p53−/−) or PTEN-floxed (PTEN−/−) primary cultures (n = 3) prepared from mouse tumors (as described in Materials and Methods), compared with double-floxed (PTEN−/−p53−/−) mouse brains following animal injection with a control vector (no PDGF) (n = 4). For siRNA transfection and/or pifithrin-α incubation, 24 h before any experiment U87-PDGF cells were plated onto 12-well plates at a density of 6 × 10⁴ cells/well (RNA quantification) or 6-well plates at 1.1 × 10⁵ cells/well (protein quantification). Complexes, prepared as described in Materials and Methods, were added to the cells at a final concentration of 0.05 or 0.1 μm and the medium was replaced by fresh DMEM after 4 h. Twenty-four hours after transfection, cells were exposed to 10 μm pifithrin-α for a period of 24 h, which was followed by the extraction of RNA and protein. (D) PTEN mRNA levels after transfection with anti-PTEN siRNAs (0.05/0.1 μm) or a noncoding sequence (Scrambled), either per se or in combination with exposure to 10 μm pifithrin-α. (E) Representative gel showing PTEN protein levels 48 h after transfection with anti-PTEN or scrambled siRNAs (n = 3). (F) Quantification of PTEN silencing observed in (E), corrected for individual α-tubulin signal intensity. The results are presented as PTEN-expression levels relative to control. (G) MiR-21 expression levels after transfection with anti-PTEN siRNAs (0.05/0.1 μm) or a noncoding sequence (Scrambled), either per se or in combination with exposure to 10 μm pifithrin-α. *P < 0.05 compared with the indicated condition. ###P < 0.001 compared with control mouse brain.

