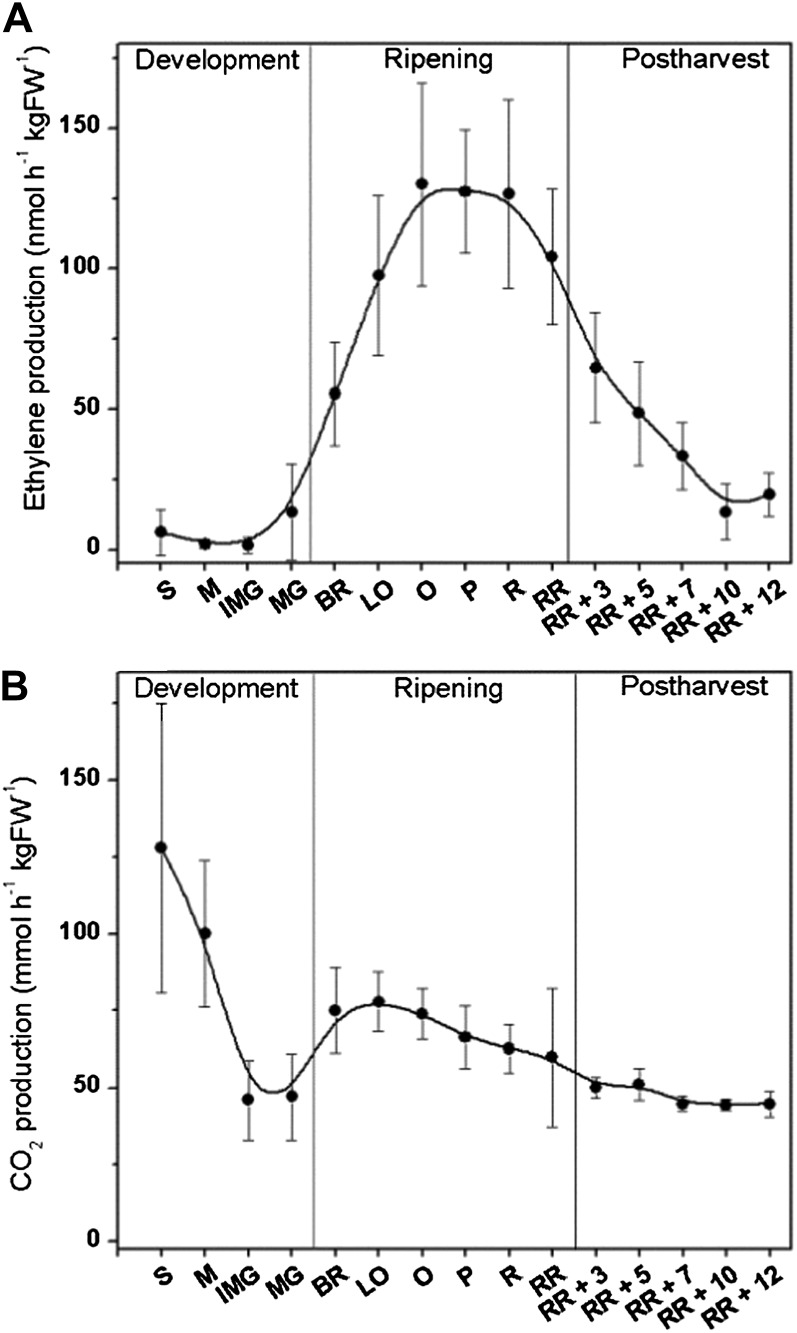
Figure 2.
Ethylene production and respiration rate during different tomato fruit development stages. A, In vivo ethylene production (nmol h−1 kg FW−1) and (B) in vivo CO2 production (mmol h−1 kg FW−1) during tomato fruit development, ripening, and postharvest storage. Error bars represent the sd of the mean of 10 biological replicates. S, Small-sized fruit; M, medium-sized fruit; IMG, immature green fruit; MG, mature green fruit; BR, breaker fruit; LO, light orange fruit; O, orange fruit; P, pink fruit; R, red fruit; RR, red ripe fruit; RR + 3, 3 d post harvest; RR + 5, 5 d post harvest; RR + 7, 7 d post harvest; RR + 10, 10 d post harvest; RR + 12, 12 d post harvest; FW, fresh weight.

