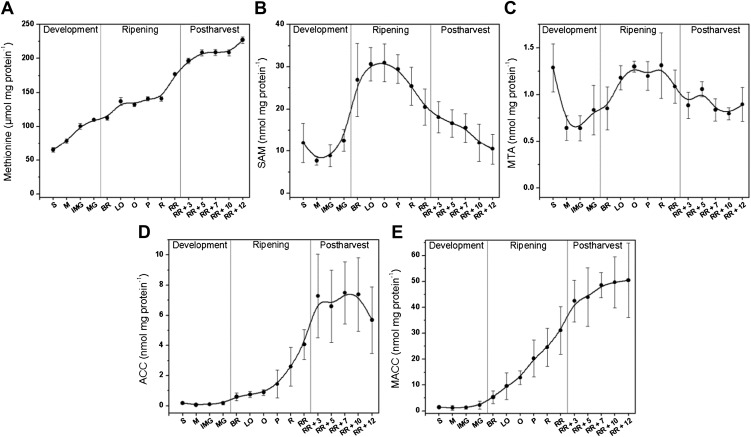
Figure 3.
Metabolic profiles during different tomato fruit development stages. A, Met (µg mg protein−1); B, SAM (nmol mg protein−1); C, MTA (nmol mg protein−1); D, ACC (nmol mg protein−1), and E, MACC (nmol mg protein−1) content during tomato fruit development, ripening, and postharvest storage. Error bars represent the sd of the mean of 10 biological replicates. See Figure 2 for maturity stage annotations.

