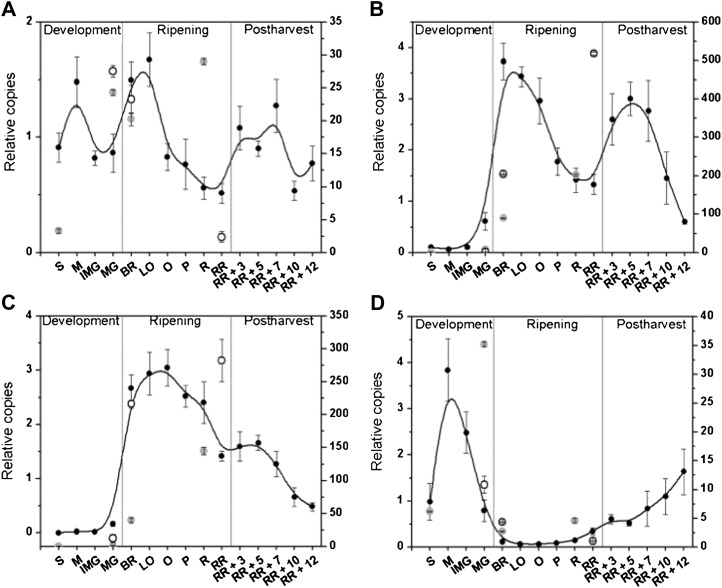
Figure 7.
Gene expression (relative copies) of ACS1 (A), ACS2 (B), ACS4 (C), and ACS6 (D) during fruit development, ripening, and postharvest storage. Error bars represent the sd of the mean of six biological replicates. See Figure 2 for maturity stage annotations. For comparison, normalized RNA sequencing data (secondary y axis) for defined maturity stages from cv Heinz 1706 (light gray circles) and S. pimpinellifolium (open circles) were included.

