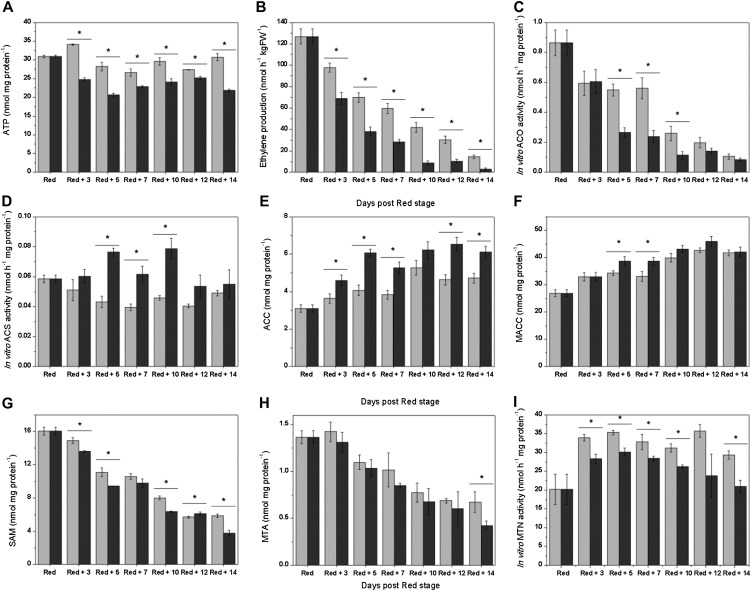
Figure 9.
Metabolic and enzymatic profiles of red tomatoes harvested and stored off the plant (dark gray) and red tomatoes kept on the plant (light gray) for 14 d. A, ATP content (nmol mg protein−1). B, Ethylene production (nmol h−1 kg FW−1). FW, Fresh weight. C, ACO in vitro activity (nmol h−1 mg protein−1). D, ACS in vitro activity (nmol h−1 mg protein−1). E, ACC content (nmol mg protein−1). F, MACC content (nmol mg protein−1). G, SAM content (nmol mg protein−1). H, MTA content (nmol mg protein−1). I, MTN in vitro activity (nmol h−1 mg protein−1). Error bars represent the sd of the mean of 10 biological replicates. Statistically significant differences (P < 0.05) between attached and detached fruit are indicated with an asterisk.

