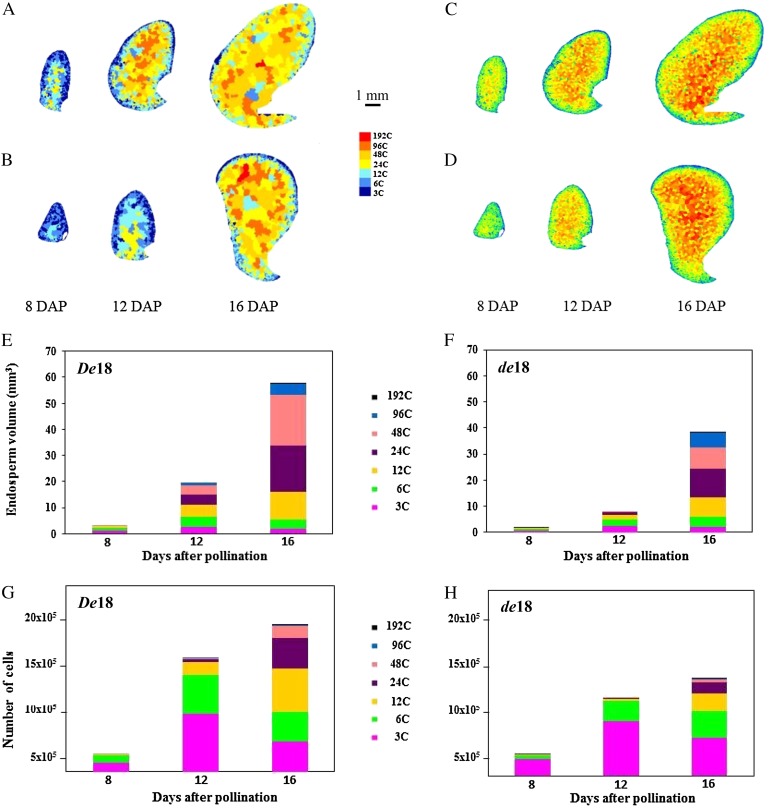
Figure 2.
A to D, Spatial distribution of cells at different ploidy classes (A and B) and volumes (C and D) on the longitudinal sections of De18 (A and C) and de18 (B and D) endosperms at 8 to 16 DAP. E to H, Number of cells by volume and total number of endosperm cells belonging to different C value classes in De18 (E and G) and de18 (F and H). Endopolyploid cells with C values >6 are represented by a color scale from azure (12C) to red (192C). The cell volume is presented with a color scale ranging from blue (1 × 10⁻³ µm3) to red (5,000 × 10−3 µm3).

