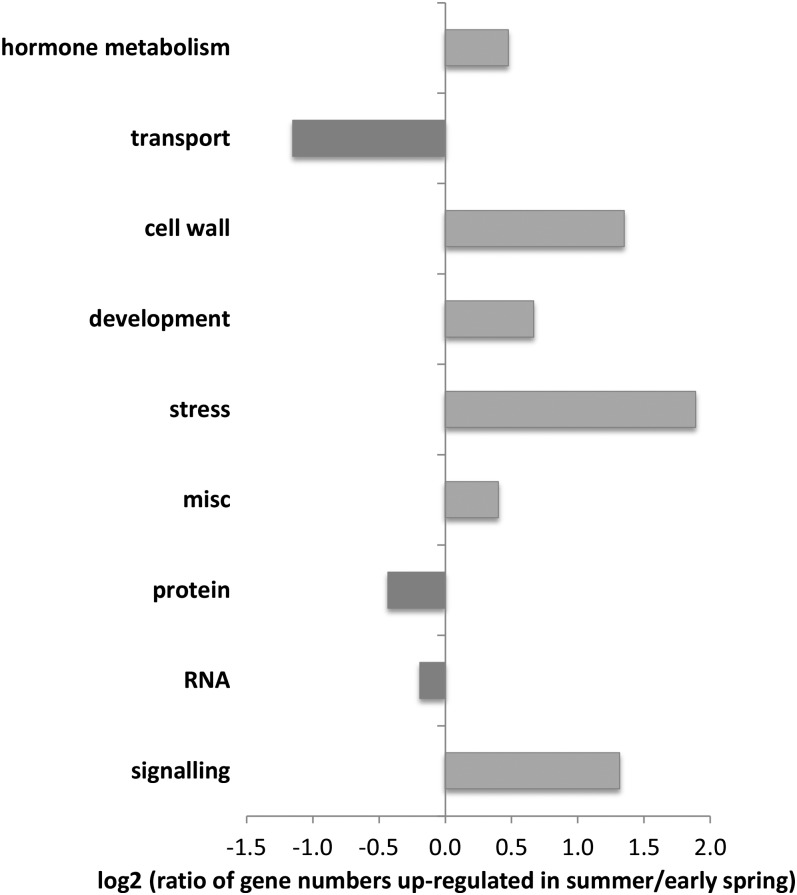
Figure 3.
MapMan analysis of the 500 most significantly regulated mapped genes (chosen based on the adjusted P values) from summer versus early-spring samples. These genes were imported into MapMan 3.5.1 and classified accordingly. Presented clusters were restricted to those pathways containing 10 or more genes. Since the group of unassigned genes was also not included, only 193 (65.7%) of the 294 genes up-regulated in summer and 115 (55.8%) of the 206 genes up-regulated in early spring are shown. Negative values indicate clusters with higher induction in early spring; positive values indicate clusters with higher induction in summer.

