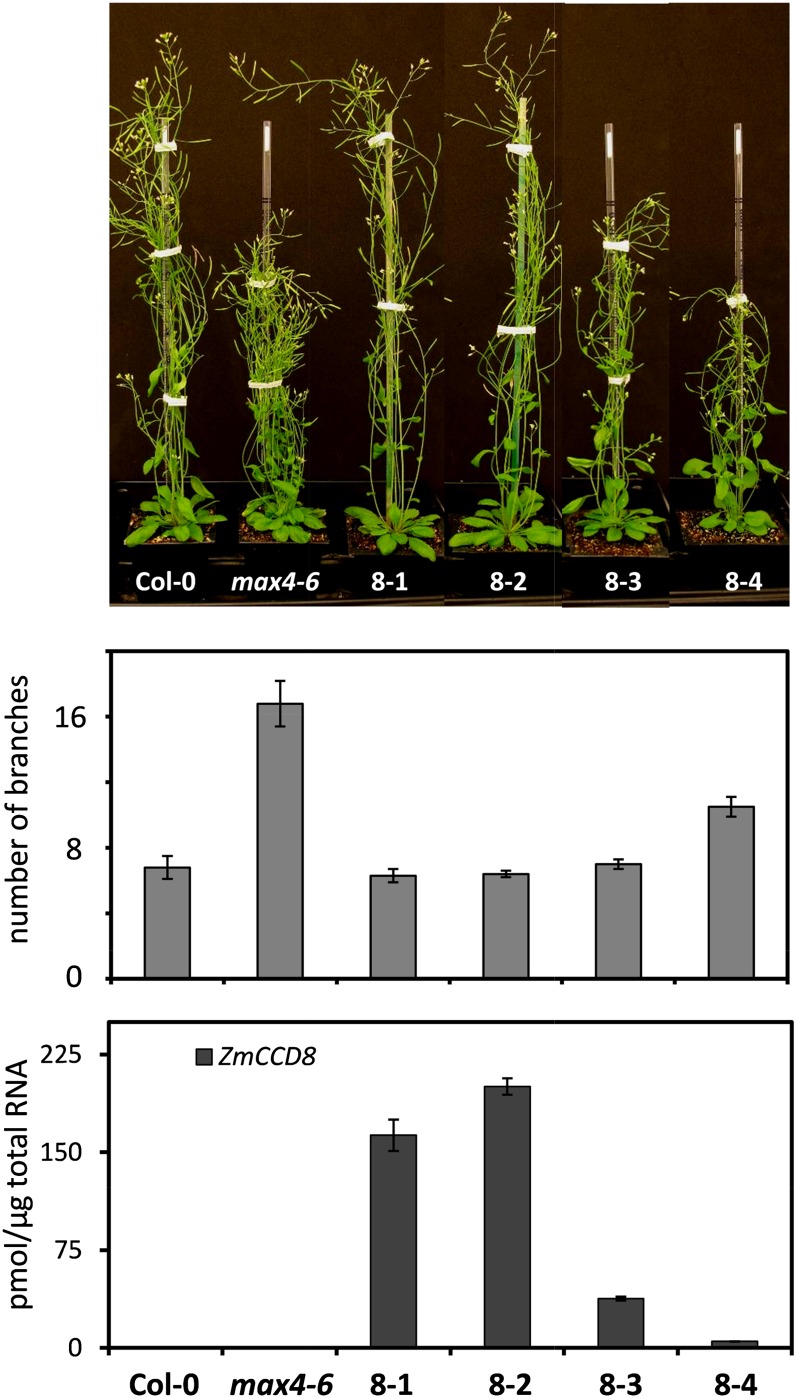
Figure 2.
Complementation of the Arabidopsis max4-6 mutant by a Pro-35S::ZmCCD8 transgene. The number of rosette branches for each independent transgenic line is shown in the bar graph below their images. Values are means ± se (n = 6). Transcript levels of the overexpressed ZmCCD8 for each line were determined by quantitative RT-PCR. Values are means ± se (n = 3). Col-0, Columbia-0. [See online article for color version of this figure.]

