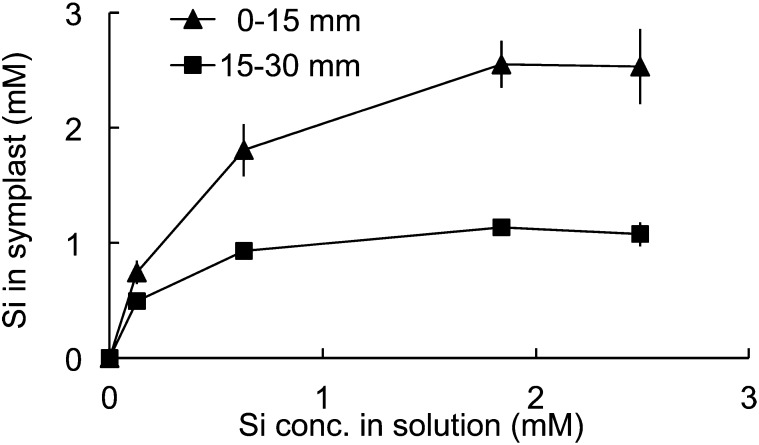
Figure 5.
Root spatial kinetics of Si uptake. The seedlings were exposed to a nutrient solution containing different Si concentrations. After 6 h, the root tips (0–15 mm) and the basal root region (15–30 mm) were excised and the cell saps were extracted. Data are means ± sd of three biological replicates.

