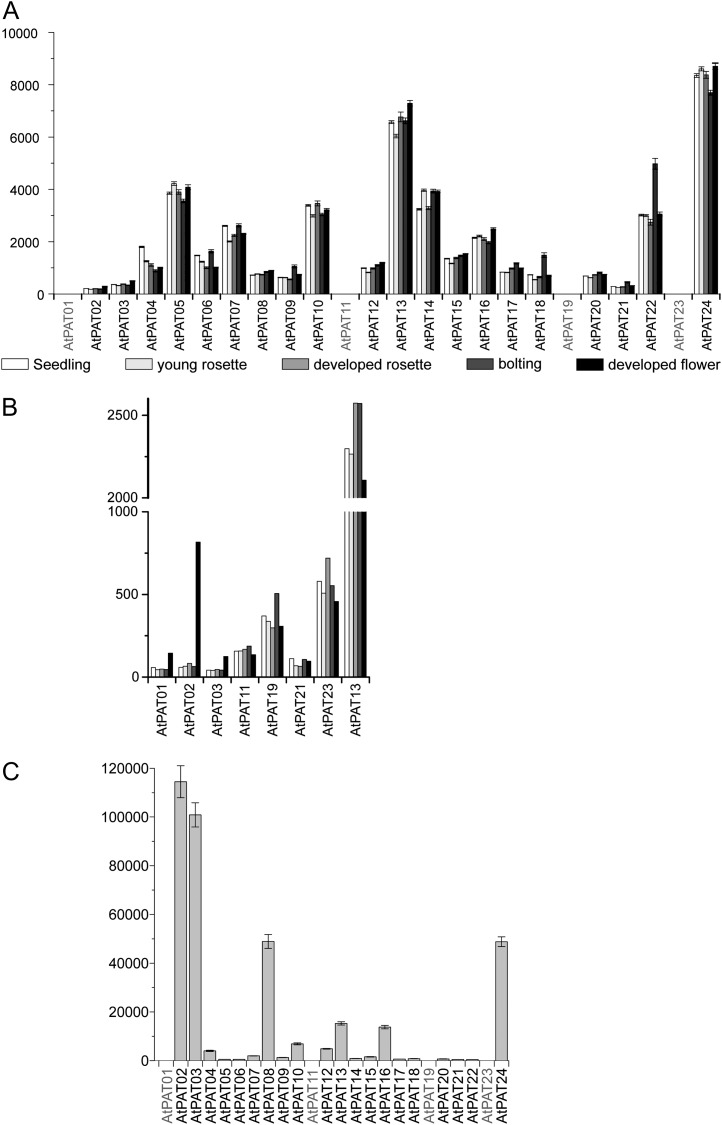
Figure 5.
Expression of Arabidopsis PATs. A, Global expression values of Arabidopsis PATs obtained from Genevestigator at different developmental stages (seedling, white bar; young rosette, light-gray bar; developed rosette, medium-gray bar; stem, dark-gray bar; flowers, black bar). Note that the AtPATs 1, 11, 19, and 23 are not present on the ATH1 microarray chip. Bars represent mean values. Error bars represent sd. B, Expression of the AtPATs 1, 2, 3, 11, 19, 21, and 23 was compared with the expression of AtPAT13 at different developmental stages (seedling, white bar; young rosette, light-gray bar; developed rosette, medium-gray bar; stem, dark-gray bar; flowers, black bar). Values were obtained from At-TEX using TileViz. C, Expression values of PATs in Arabidopsis pollen obtained from Genevestigator based on ATH1 microarray analysis. Bars represent mean values. Error bars represent sd.

