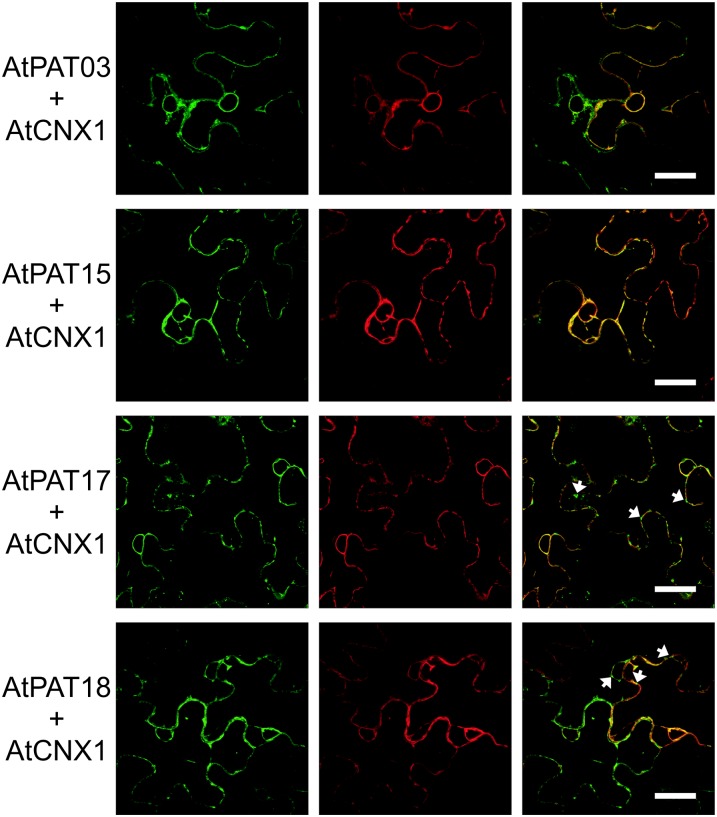
Figure 6.
ER localization of the Arabidopsis PATs 3, 15, 17, and 18. PAT.GFP fusions were transiently expressed in N. benthamiana leaves, and fluorescence is shown at the left. PATs were coexpressed with mCherry.CNX1 shown in the middle. The merged fluorescence is shown at the right. Arrows indicate the vesicle observed for PAT.GFP fusions. Bars, shown in the merged picture, = 20 µm. [See online article for color version of this figure.]

