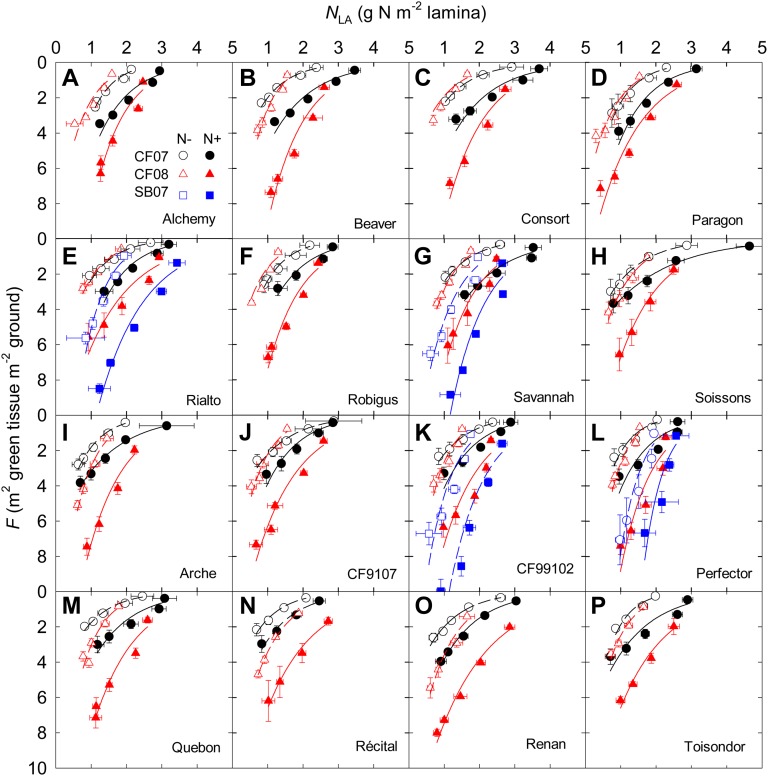
Figure 2.
Cumulative GAI counted from the top of the canopy (F) versus NLA at anthesis for 16 cultivars of wheat (A–P) grown in the field under N− and N+ at CF during the 2006–2007 (CF07) and 2007–2008 (CF08) growing seasons and for four cultivars grown at SB during the 2006–2007 growing season (SB07). Data are means ± se for three independent replicates. Lines were fitted to the data by reduced major axis regression using logarithmic transformation of Equation 4. Symbols and lines are as in Figure 1.

