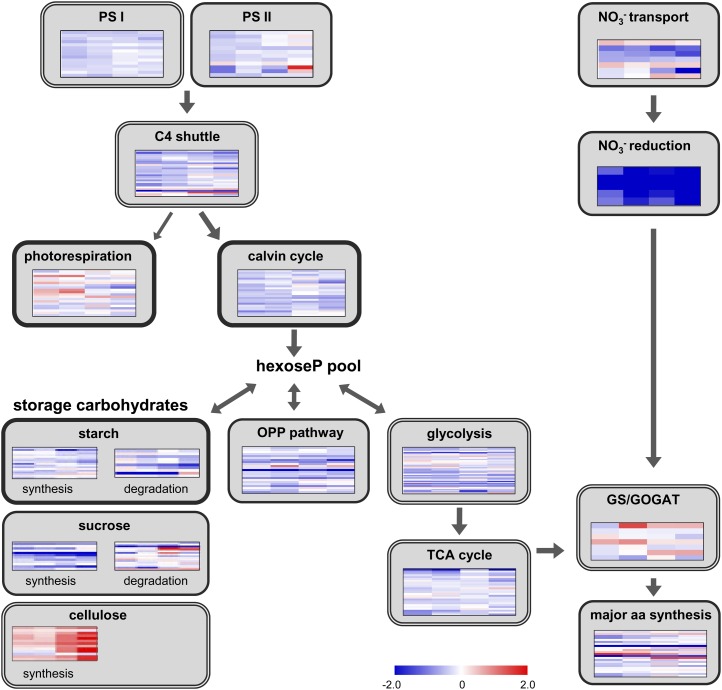
Figure 6.
Transcriptional changes of primary C and N metabolism under low N. From left to right, the four columns represent changes measured in A188 at 20 d, in B73 at 20 d, in A188 at 30 d, and in B73 at 30 d. Heat maps show log2 fold changes in low- versus high-N conditions. Thin frame, Pathway preferentially in mesophyll; double frame, pathway in both cell types; thick frame, pathway preferentially in bundle sheath.

