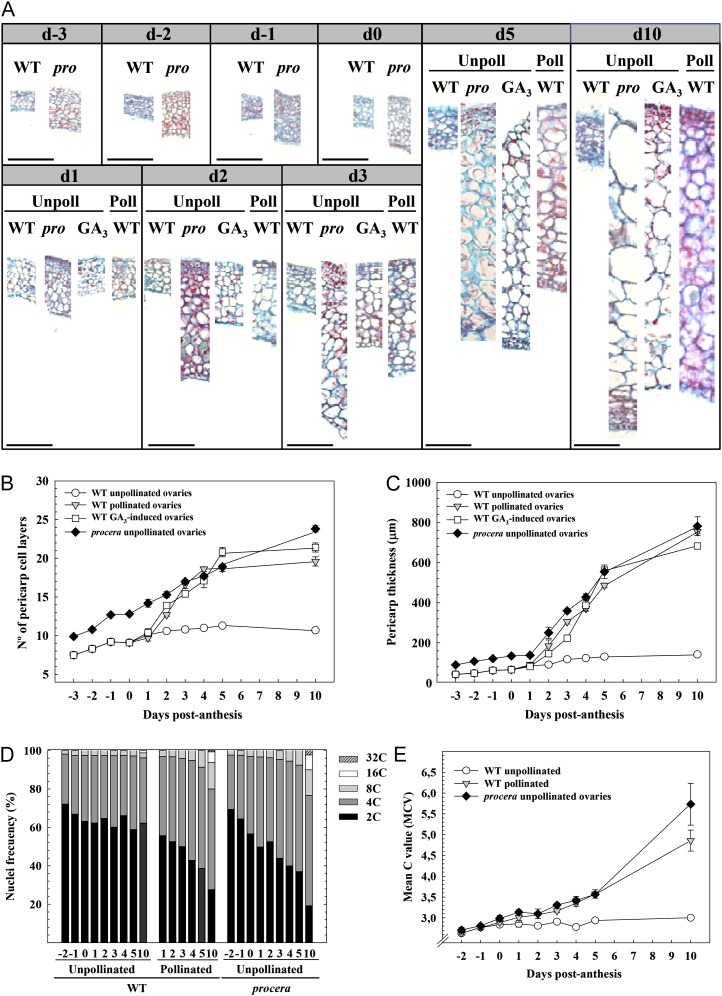
Figure 3.
Time course between day −3 and day 10 of cell division and expansion in pericarp of pro, wild-type (WT) pollinated, and wild-type unpollinated control and GA3-treated ovaries. A, Photographs of transverse sections from pro and wild-type pollinated ovaries. B, Number of cell layers. C, Pericarp thickness. D, Nuclei frequency. E, Mean C values (MCV). [See online article for color version of this figure.]

