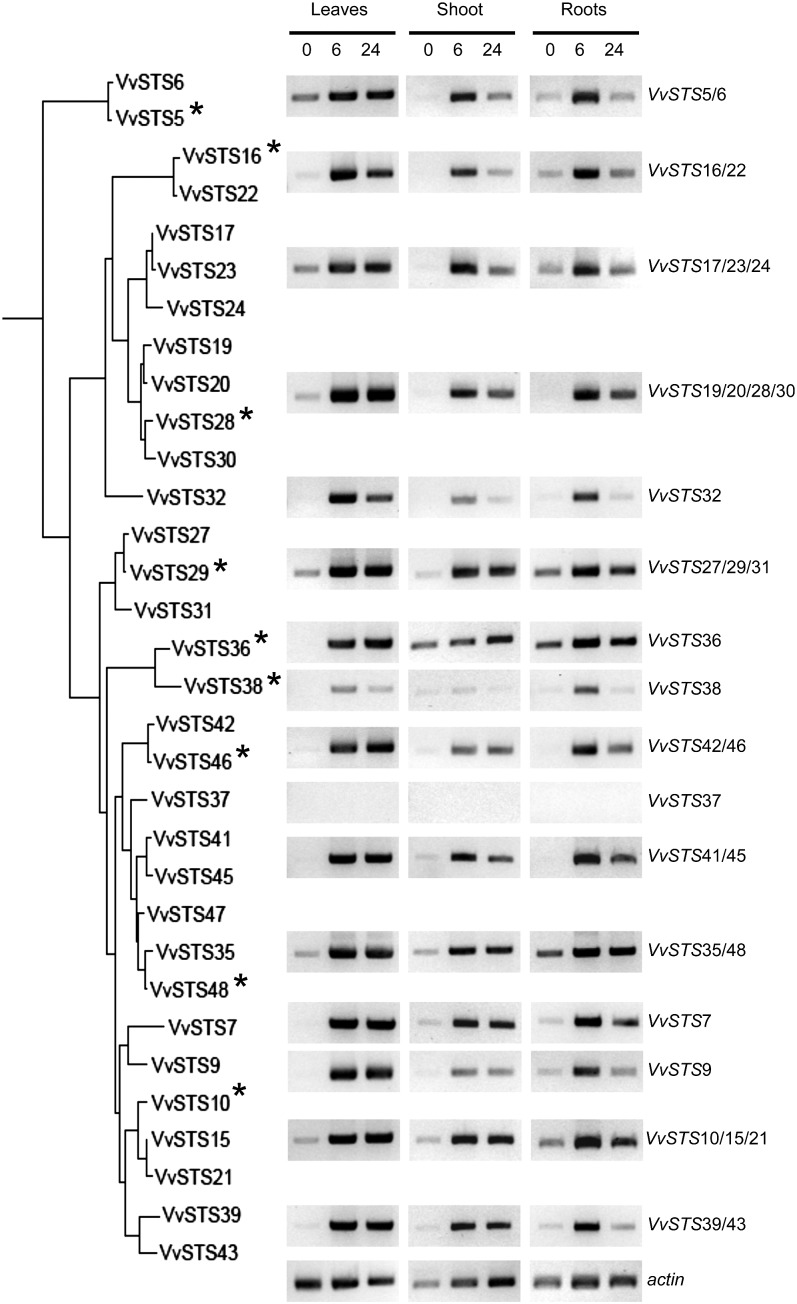
Figure 2.
Stress induction of STS genes expression. STS gene expression was analyzed of by semiquantitative RT-PCR in leaves, shoots, and roots of grapevine plantlets at t = 0 (control), 6, and 24 h after exposure to UV light. The data shown are representative of three independent experiments. Genes selected for functional analysis are indicated with an asterisk.

