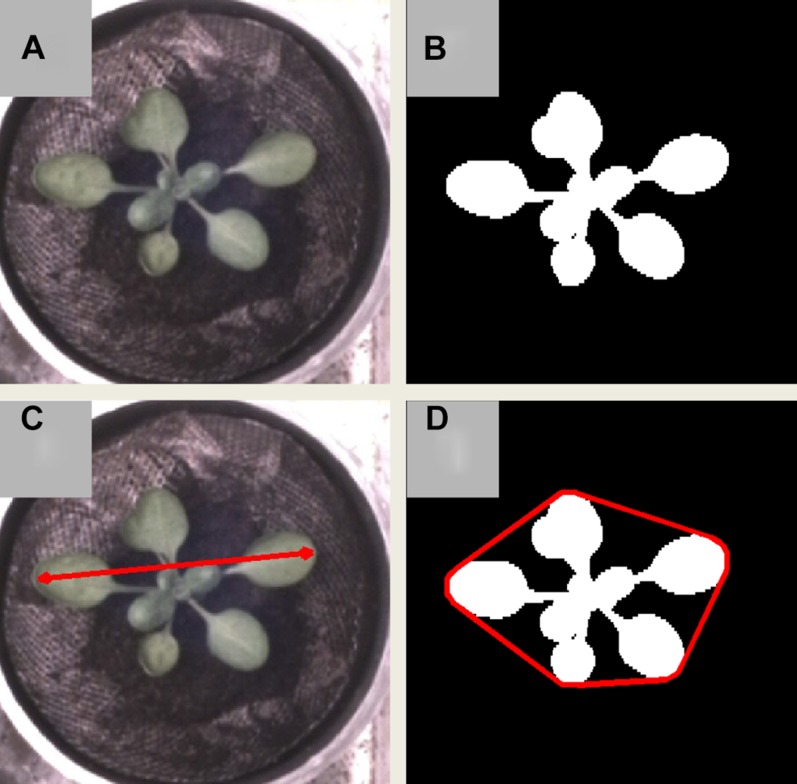
Figure 2.
An example of different rosette measurements on a VIS image: the actual VIS image of a rosette (A), the area detected by Rosette Tracker (B), the diameter of the rosette corresponds to the length of the red line (C), and depict the compactness of the rosette (D), i.e. the ratio of the area corresponding to the actual rosette over the area enclosed by the convex hull, shown as a red line. [See online article for color version of this figure.]

