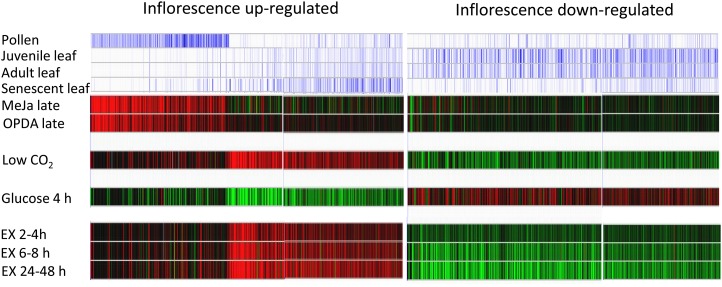
Figure 4.
Inflorescence transcriptome changes are similar to those in Arabidopsis leaves developmentally senescing or given treatments that alter their carbohydrate status. Meta-analysis was performed in Genevestigator V3 on the sets of 758 up-regulated and 741-down-regulated inflorescence genes. Treatments that responded most similarly with the gene sets are shown. Individual genes are represented by colored vertical lines. Blue lines indicate increased transcript abundance and were obtained for pollen and the leaf developmental series using the Anatomy Tool. Red and green lines indicate increased and decreased transcript abundance, respectively, and were obtained using the Stimulus Tool. For full details of treatments and tissues used, see “Materials and Methods.” MeJa Late and OPDA Late indicate responses in stamens of opr3 mutants after treatment with either 0.03% methyl jasmonate or 0.03% OPDA for 22 h. Low CO2 indicates the response in leaves of whole rosettes illuminated at the end of the night for 4 h at 50 µL L−1 [CO2] compared with ambient 350 µL L−1 [CO2]. Glucose 4 h indicates the response in seedlings grown in liquid medium containing 0.5% Glc for 7 d, then in medium lacking Glc for 24 h, then in medium containing 3% Glc for 4 h. EX indicates the response in leaves of whole rosettes held after their 14-h dark cycle for extended periods in the dark.

