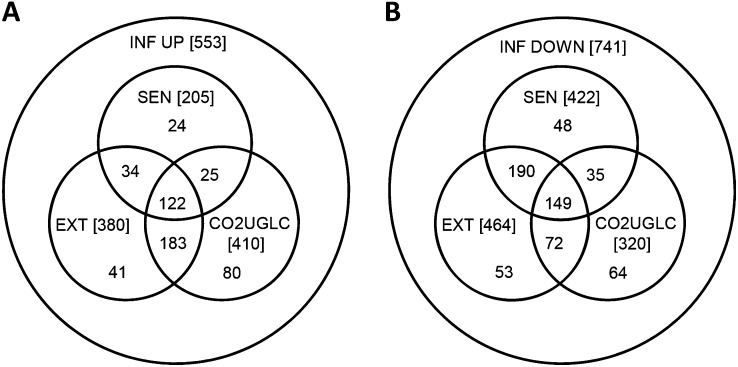
Figure 5.
Transcript abundance of the majority of the senescence up-regulated genes is affected by tissue carbohydrate status. A, Treatments that affect the transcript abundance of the up-regulated gene set. B, Treatments that affect the transcript abundance of the down-regulated gene set. A 2-fold cutoff was used for transcript abundance response for the senescence, extended night, and carbohydrate-responding treatments. Full details of the treatments are presented in “Materials and Methods.” CO2UGLC, Transcript changes in common with leaves of rosettes illuminated at the end of the night for 4 h at 50 µL L−1 [CO2] combined with transcript changes that changed oppositely in response to the addition of 3% Glc for 4 h to Glc-starved seedlings; EXT, transcript changes in leaves of whole plants exposed to a combined 24- and 48-h extended night; INF, inflorescence; SEN, transcript changes in developmentally senescent leaf.

