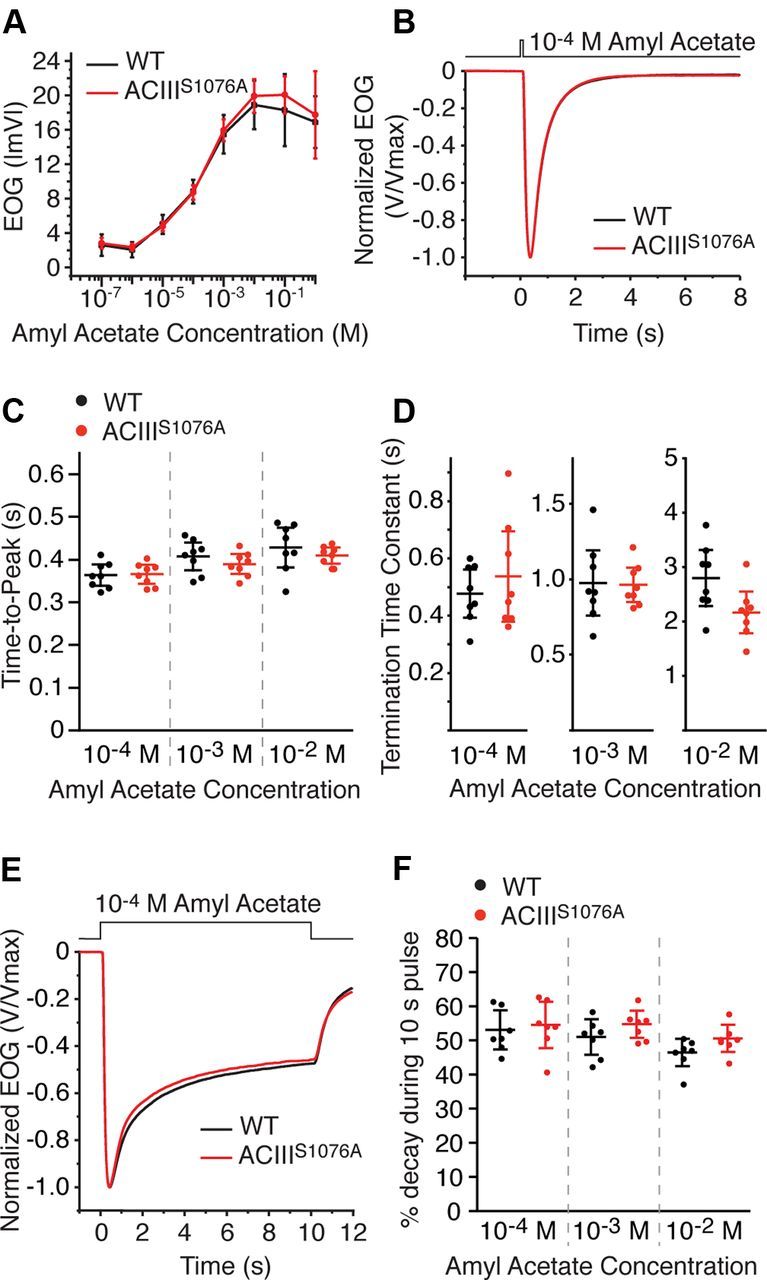
Figure 2.

EOG analysis of OSN response to single odorant pulses. A–D, EOG analysis to a single 100 ms pulse of amyl acetate. A, Dose–response relations of EOG peak amplitude from wild-type (n = 5) and ACIIIS1076A (n = 4) mice. Concentrations on the x-axis are those of the liquid solution. Data points are linked with straight lines. B, Averaged EOG traces to 10−4 m amyl acetate (wild-type, n = 8; ACIIIS1076A, n = 8). Responses are normalized with the peak giving the unit for comparison of response kinetics. C, Time-to-peak, defined as the time from the initiation of odorant pulse to the response peak. D, Termination time constants, determined by a single exponential fit to the decay phase of the EOG trace. E, F, EOG analysis to a 10 s pulse of amyl acetate. Data are taken from the recording of the first response in the paired sustained pulse experiments shown in Figure 3. E, Averaged EOG traces to 10−4 m amyl acetate (wild-type, n = 7; ACIIIS1076A, n = 7). Responses are normalized with the peak given the unit for comparison of the amplitude reduction over the course of the stimulation. F, Amplitude reduction during stimulation, presented as the percentage of the amplitude at 10 s to the peak. Wild-type and ACIIIS1076A mice show comparable amplitude reduction during the stimulation. All error bars are 95% CI.
