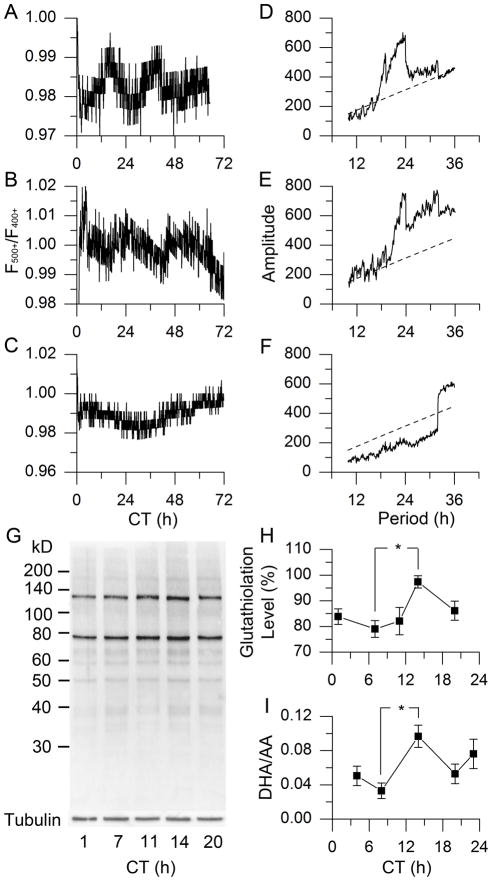
Fig. 1.
Circadian oscillation of redox state in rodent SCN. (A–C) Real-time imaging of relative redox state in SCN of wild-type (WT) rat (A), WT mouse (B) and Bmal1 −/− mouse (C). (D–F) χ2 periodograms (solid) of redox oscillations in SCN of WT rat (D), WT mouse (E), and Bmal1 −/− mouse (F), based on data in A–C, respectively, with the confidence interval of 0.001 (dashed); τrat = 23.74 ± 0.26 h (mean ± SD), τmouse = 23.75 ± 0.30 h; N = 5 for each group. (G) Glutathiolation patterns of BioGEE incorporation into rat SCN tissue over 5 points of circadian time (CT, which has a free-running time-base driven by the endogenous clock). (H) Protein glutathiolation over 5 CTs in rat SCN (P < 0.05, One-Way ANOVA; *, P < 0.05, Tukey’s Honestly Significant Difference (HSD) Test; N = 6). (I) DHA/AA ratio in rat SCN over 5 CTs (P < 0.05, One-Way ANOVA; *, P < 0.05, Tukey’s HSD Test; N = 3).

