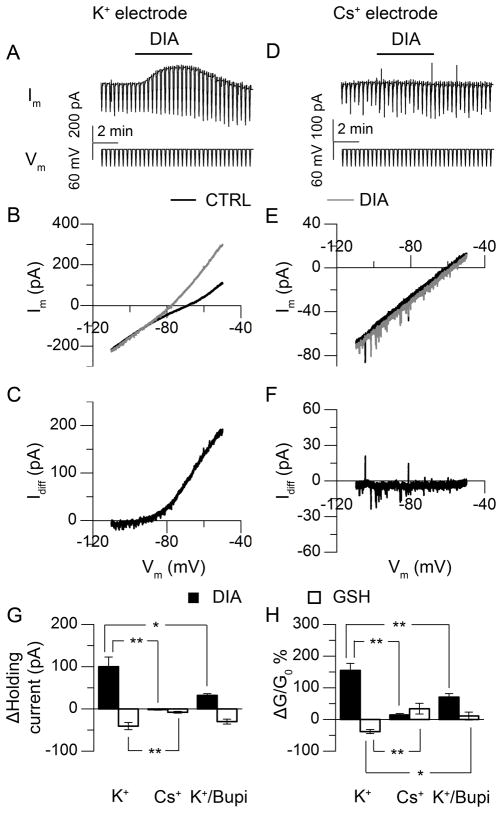
Fig. 3.
Redox regulation of neuronal excitability through K+ current (CT 9–13). (A) Voltage-clamp recording of SCN neuron, with repeating slow-ramped voltage commands from −50 mV to −110 mV. (B) I–V curve constructed based on the command voltage and membrane current recorded, before (black) and during (grey) DIA treatment. (C) The DIA-evoked current as calculated from the difference in the membrane response in (B). (D–F) Similar voltage clamp recordings as (A–C), except that Cs+ replaced K+ in the patch pipette. (G, H) Holding current (G) and conductance (H) changes induced by redox reagents (DIA, black; GSH, white) with electrodes containing K+ (P < 0.01, paired Student’s t-Test to control; N = 6), Cs+ (P > 0.05 (current), P < 0.01 (conductance) for DIA, P < 0.05 for GSH, paired Student’s t-Test to control; N = 6), or K+ (in electrode) with bupivacaine (Bupi, 100 μM) in bath (P < 0.01, paired Student’s t-Test to control; N = 5); for the comparison across groups, P < 0.01, One-Way ANOVA; **, P < 0.01, *, P < 0.05, Tukey’s HSD Test.

