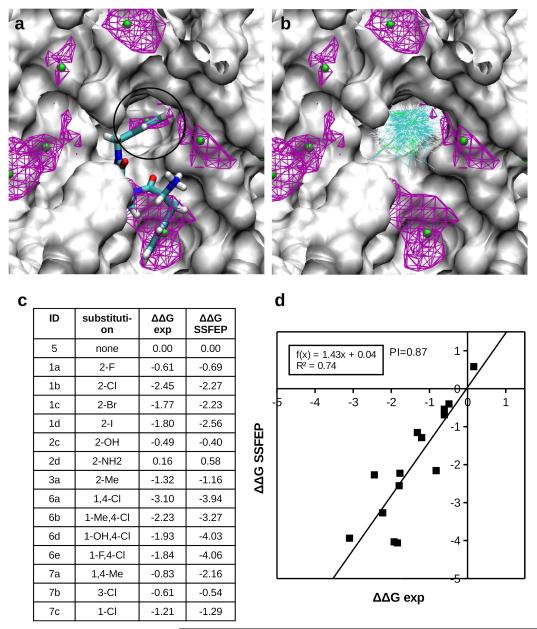
Figure 5.
(a) Crystal structure of apo α-thrombin (PDB 3D49) overlaid with benzene FragMap displayed at a grid free energy cutoff of −1.2 kcal/mol in purple wireframe representation. Green spheres show the cluster centers of the favorable benzene binding regions. The encircled region shows the S1-pocket. (b) the conformations selected from the SILCS simulations for SSFEP calculations. (c) and (d) Relative binding free energies of benzene analogues computed using the SSFEP protocol applied to SILCS trajectories versus experimental data. The units are kcal/mol.

