
Figure 4.
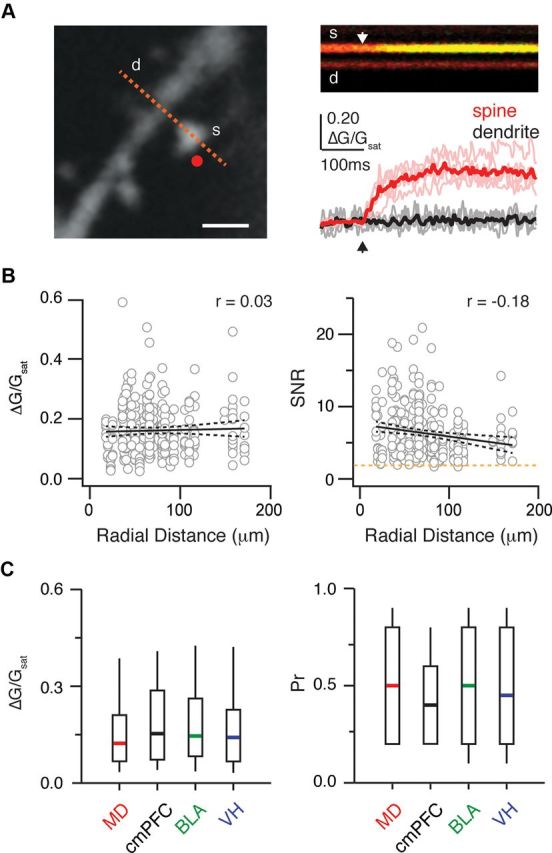
Unbiased detection of connections onto spines. A, Left, Two-photon image of dendrite (d) and spine (s), showing two-photon uncaging spot (red dot) and line-scan path (red dashed line). Scale bar, 1 μm. Top right, Example line scan showing morphology (red) and ΔG/R signal (green) in the spine and dendrite. White arrow indicates the uncaging time. Bottom right, Mean (thick lines) and individual (thin lines) ΔG/Gsat transients in the spine (red) and dendrite (black). Arrow indicates the uncaging time. B, Amplitudes (left) and SNR (right) of uncaging-evoked synaptic Ca signals as a function of radial distance from the soma. Solid and dashed lines represent linear fits and 5–95% confidence intervals, respectively. Orange dashed line indicates the detection threshold. Correlation coefficients (r values) are labeled in the upper right-hand corners. C, Left, Summary of light-evoked synaptic Ca signal amplitudes for each input from mapping experiments. Right, Summary of probability of release (Pr) for each input from these light-evoked synaptic Ca signals.