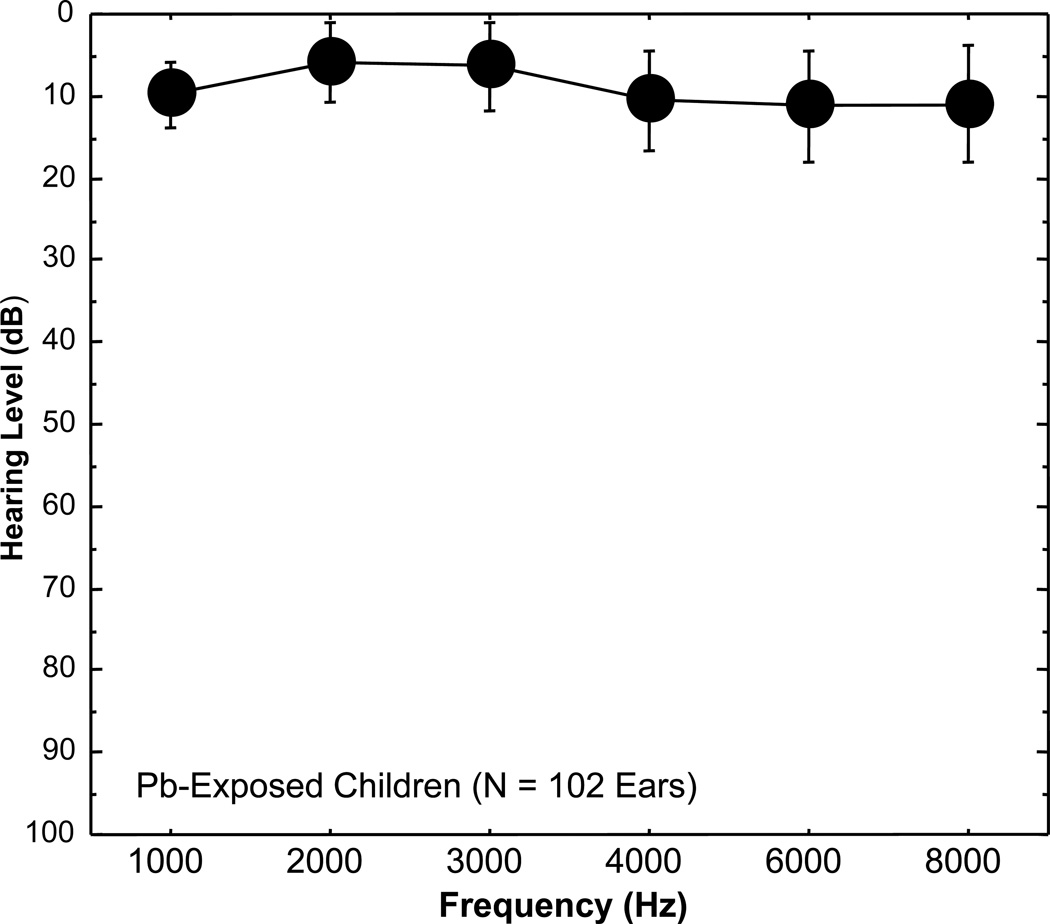
Figure 1.
Mean hearing levels (HL) with standard deviation bars are plotted as a function of frequency (1000, 2000, 3000, 4000, 6000 or 8000 Hz) using a traditional audiogram format for 102 ears of 53 lead (Pb) exposed children residing in rural Pb-glazing areas in the Andes Mountains of Ecuador. Note that on the traditional audiogram, zero is plotted at the top of the graph. The audiogram shows that the Pb-exposed children’s mean hearing thresholds are well within the normal range (≤ 20 dB HL).

