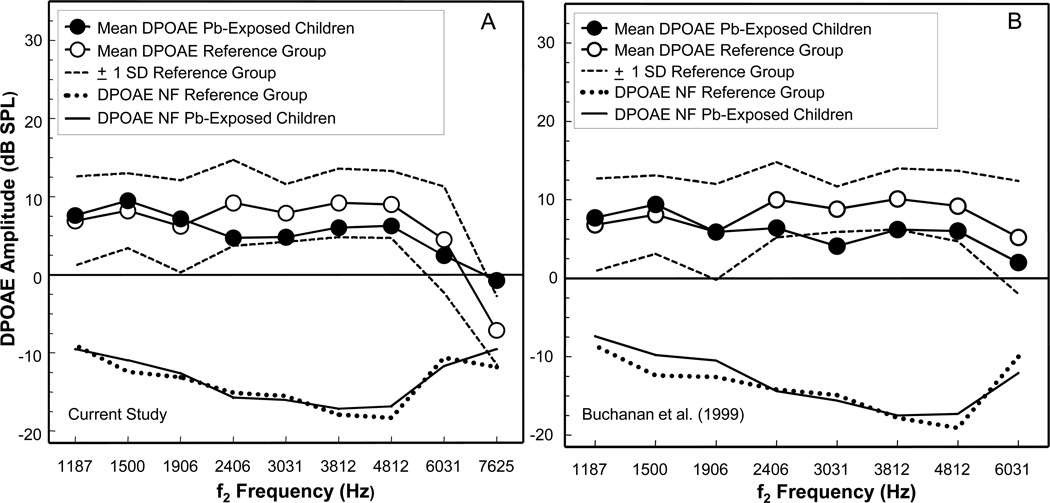
Figure 3.
Mean distortion product otoacoustic emissions (DPOAE) amplitude (dB SPL) data obtained in the current study (A) for 102 ears of 53 lead (Pb)-exposed children residing in rural Pb-glazing villages in the Ecuadorian Andes are compared to DPOAE results obtained in a previous study (B) on a different group of 28 ears of 14 Pb-exposed children residing in the same study area. For both graphs, mean DPOAE amplitude for the Pb-exposed children are compared to mean DPOAE amplitude of a reference group (N = 33 and 26 for graph A and B, respectively) of non-Pb exposed children and young adults. The broken lines in the upper portion of the graphs represent the ± 1 standard deviation range for the reference group. Mean DPOAE noise floors (NF) are shown as solid and dotted lines at the bottom of each graph for the Pb-exposed and reference group, respectively. Note that graph A includes the f2 frequency of 7625 Hz, which is not included in graph B. Figure 2B is adapted from Buchanan et al. (1999).

