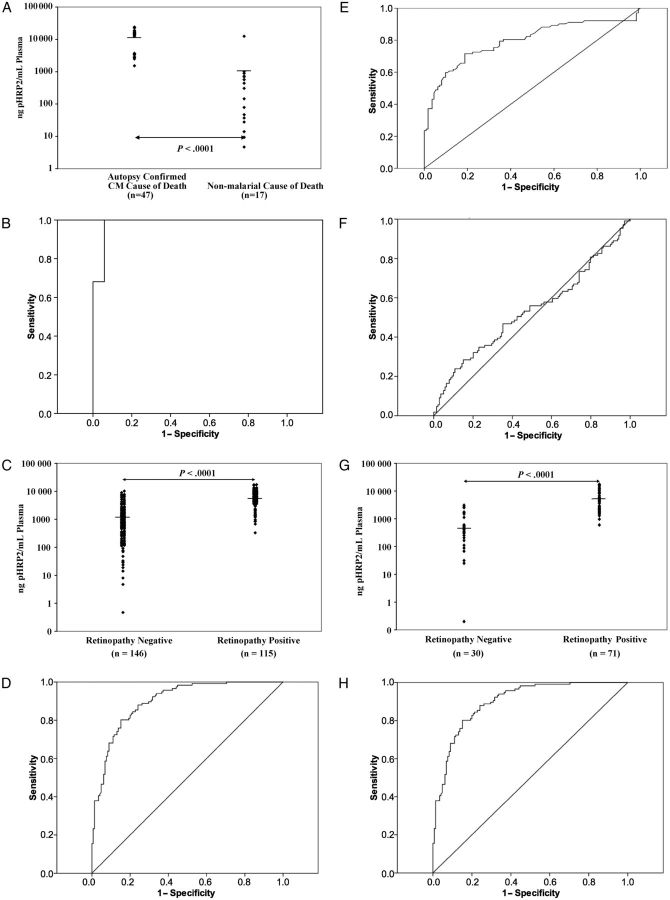
Figure 1.
Parasite histidine-rich protein 2 (pHRP2) concentrations for study 1 (A), study 2 (C), and study 3 (G) and receiver operating characteristic (ROC) curves for pHRP2 for study 1 (area under curve [AUC], 0.98) (B); pHRP2 (AUC, 0.90) (D), platelets (AUC, 0.79) (E), and periperhal parisitemia (AUC, 0.53) (F) for study 2; and pHRP2 for study 3 (AUC, 0.96) (H). Each of the studies resulted in statistically significant differences in pHRP2 concentrations in the groups being compared.

