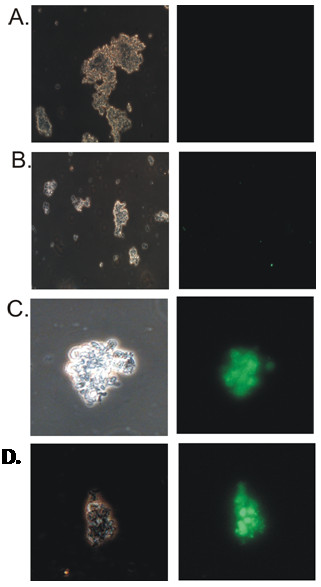
Figure 6.

TUNEL assay analysis of Apoptosis in control and NS1 transfected cells. The cells were analyzed 24 h post transfection using fluorescently labeled anti-BrdU antibodies. The fluorescence was detected microscopically. Left panel are cells visualized under visible light without filter; Right panel are cells visualized under specific filters for fluorescence detection. The left and the right panel are the cells under same microscopic field A. Untransfected control cells B. Cells transfected with pcDNA 3.0 (-) vector C. cells transfected with pcDNA3-H5N1-NS1 construct D. cells transfected with pcDNA3-H11N1-NS1 construct.
