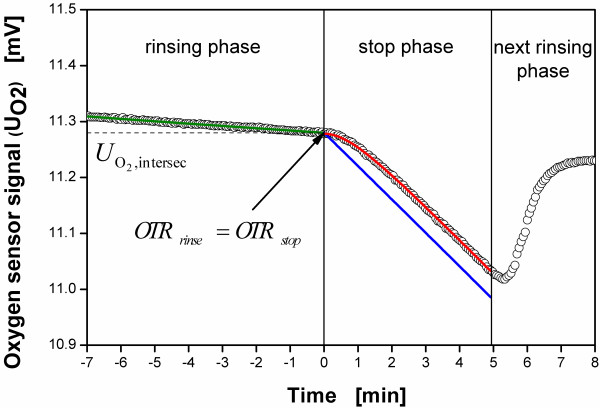
Figure 2.
Example of a calibration during a RAMOS measurement, with measured data from the oxygen sensor (circle), smoothing spline fit of the rinsing phase according to equation (B.3) (green line), optimized polynomial of the stop phase according to equation (B.5) used for solving equation (B.4) (blue line) and delayed signal of the stop phase according to the delay model described by equation (B.6) (red line.)

