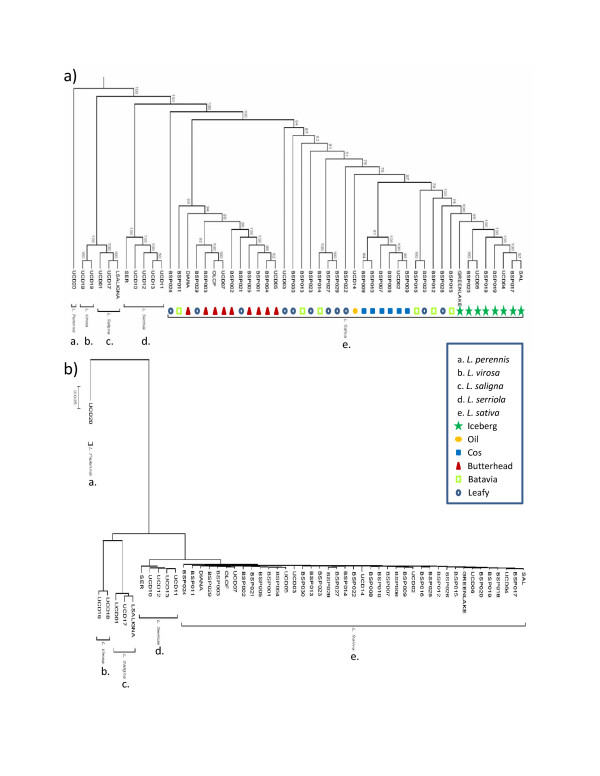
Figure 7.
Phylogenetic trees estimating the relationship of all individuals in the diversity panel. a) Dendogram estimating the relationship of genotypes in the diversity panel. Bootstrap values indicate the confidence in branch positioning. b) Representative phylogram showing the relative relatedness of individuals. Each species is monophyletic

