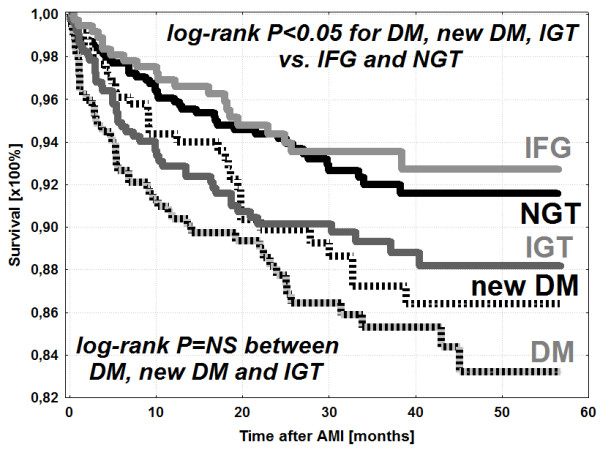
Figure 2.

Kaplan-Meier survival curves in particular study groups, NGT – normal glucose tolerance, New DM – newly diagnosed diabetes mellitus, DM – diabetes mellitus diagnosed previously, IGT – impaired glucose tolerance, IFG – impaired fasting glucose, IFG and control group vs IGT, new onset DM and DM; p < 0.05. IFG vs control group; p = NS. IGT vs new onset DM vs DM; p = NS. Time in months.
