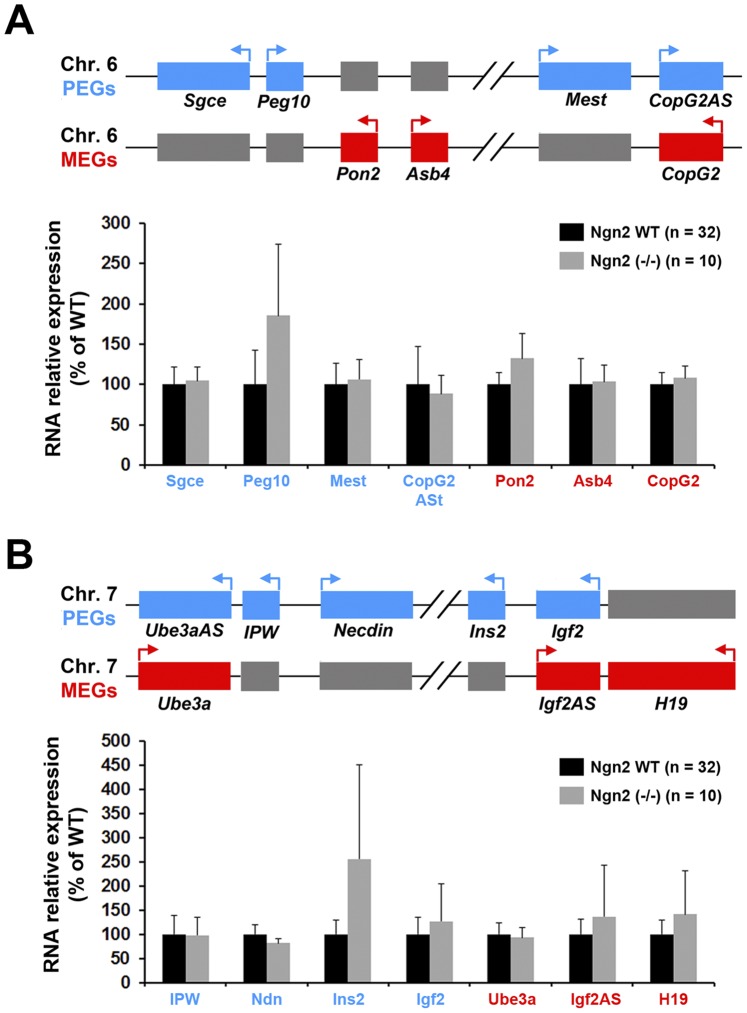
Figure 3. Expression of imprinted genes outside the Dlk1-Gtl2 locus is not affected in Ngn2 KO mice.
A. Changes in RNA expression assessed by qPCR in Ngn2 WT and KO mice of 7 IGs on chromosome (Chr.) 6. A schematic representation of the locus is shown above the graphs. B. Changes in RNA expression assessed by qPCR in Ngn2 WT and KO mice of 7 IGs on Chr.7. A schematic representation of the locus is shown above the graphs. For both loci, the active transcribed alleles are colored in blue for PEGs and red for MEGs. The silenced alleles are colored in grey. Arrows indicate the sense of transcription. Expression of none of the 14 IGs was significantly affected in Ngn2 KO mice (Mann-Whitney’s test).

