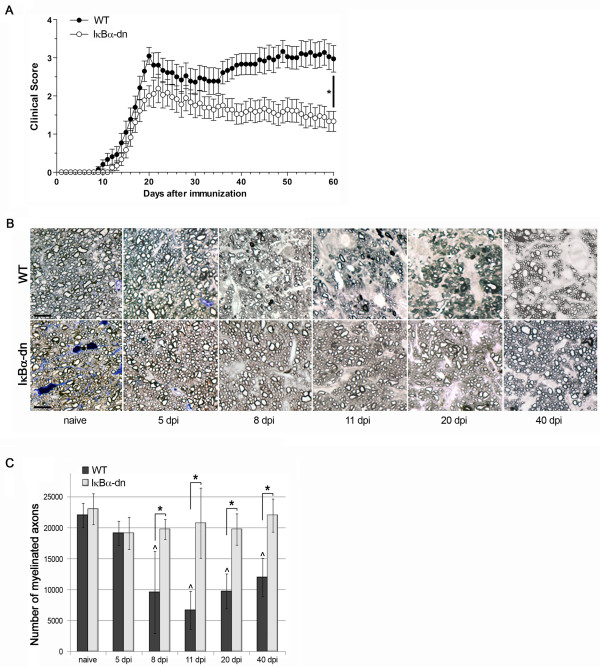
Figure 1.
Histological analysis and quantification of myelinated axons in the optic nerve of mice with ON. (A) Clinical course of MOG(35–55)-induced EAE in WT and GFAP-IκBα-dn mice. EAE symptoms were scored daily for 60 days as described in Materials and Methods. Results are expressed as the daily mean clinical score ± SEM of 24 animals/group from three independent experiments;*P < 0.0001, Mann–Whitney test. (B) Histological analysis of PPD-stained, resin-embedded optic nerves of WT and GFAP-IκBα-dn mice under naïve conditions and at various times after induction of EAE. Scale bar = 10 μm. (C) Quantification of the total number of myelinated axons in PPD-stained cross-sections of the optic nerve using Stereoinvestigator software; ^P < 0.05 vs. WT naïve; *P < 0.05, one-way ANOVA, Tukey test. Ten mice/group were analyzed.

