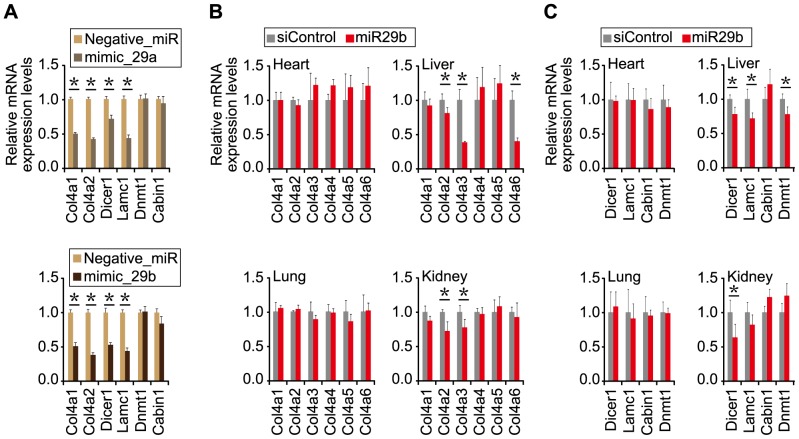
Figure 6. Gene expression profiles in miR-29-treated N2a cells and young ICR mice.
(A) Expression profiles in miR-29-treated N2a cells. MISSION microRNA Mimic (Sigma-Aldrich) has-miR-29a (mimic_29a), has-miR-29b (mimic_29b) or negative control miRNA (negative_miR) was transfected into N2a cells. Three days after transfection, total RNAs were extracted and examined by RT-qPCR followed by analysis using the delta-delta Ct method using the expression levels of Gapdh as a control. The data were further normalized to the data obtained with the negative_miR. Error bars represent standard deviations. The genes examined are indicated: Col4α1, Col4α2, Dicer1, Dnmt1, Lamc1 and Cabin1. The Col4α3–α6 genes were examined as well, but their expression was not detected in the cells. (B, C) Gene expression profiles in miR-29b-treated ICR mice. Normal ICR mice (5-week-old) were subjected to four systemic administrations (Day 1, 4, 8, and 12) of miR-29b duplex or siControl (as a negative control). Two days after the last administration, the treated mice were examined. RT-qPCR analyses were carried out as in A. The examined tissues and genes are indicated: (B) type IV collagen gene family and (C) other genes. Statistically significant decrease in the expression of genes in the miR-29b-treated mice is indicated by * (p<0.05).

