
Figure 8. Cell viability of N2a cells treated with miR-29 mimics.
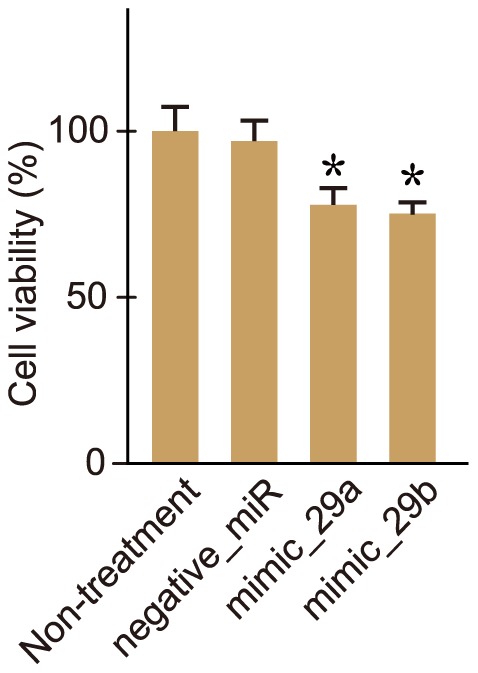
The miR-29 mimics (mimic_29a and mimic_29b) and a negative control miRNA (negative_miR) were transfected into N2a cells as in Fig. 6A. Three days after transfection, cell viability assay was performed. Data are averages of four measurements. Error bars represent standard deviations. Difference between non-treated cells and each of the treated cells was statistically analyzed by ANOVA, followed by the Dunnett's test (* P<0.05).