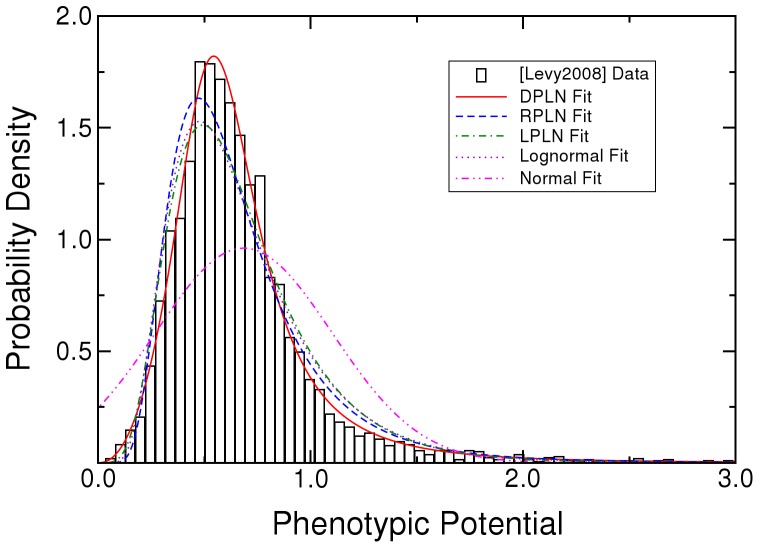
Figure 1. Probability distributions fit to a histogram of random phenotypic variation (phenotypic potential) in Saccharomyces cerevisiae gene knockouts.
Histogram data are from Table S1 in [29]. DPLN is the double Pareto-lognormal distribution. RPLN is the right Pareto-lognormal distribution. LPLN is the left Pareto-lognormal distribution. Simple Pareto and exponential distributions omitted.

