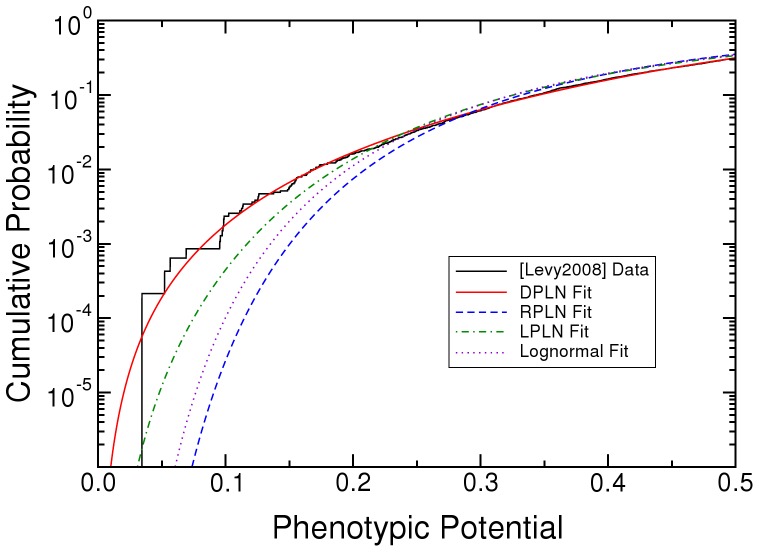
Figure 2. Lower tail of the cumulative distribution function (cdf) of random phenotypic variation (phenotypic potential) in Saccharomyces cerevisiae gene knockouts, and the DPLN, RPLN, LPLN, and lognormal fits.
Data are from Table S1 in [29]. DPLN is the double Pareto-lognormal distribution. RPLN is the right Pareto-lognormal distribution. LPLN is the left Pareto-lognormal distribution. Simple Pareto and exponential distributions omitted.

