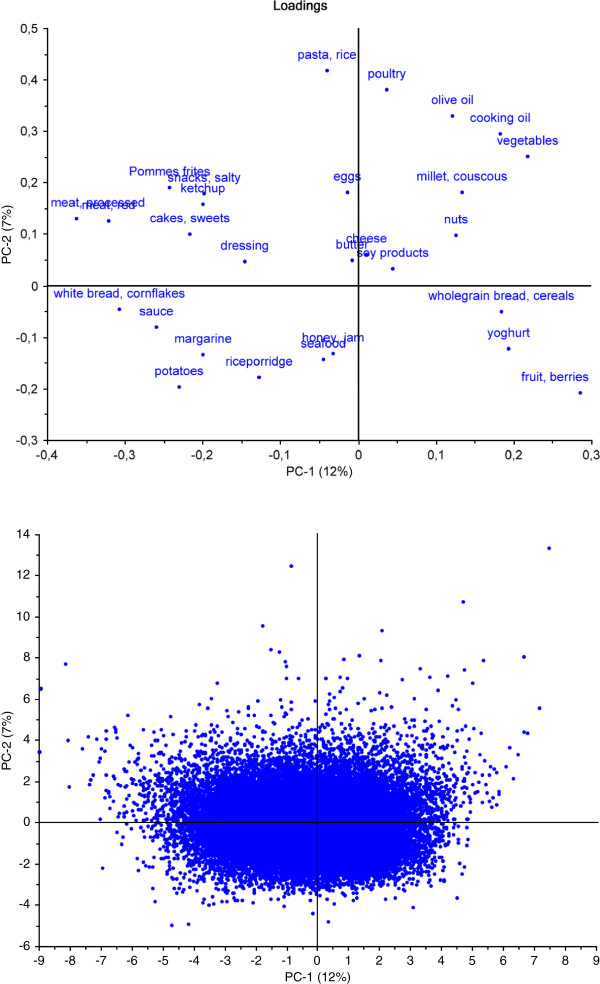
Figure 1 .
Loadings and scores plot from PCA (N = 63808). Names of overlapping food groups in the loadings plot, upper left: processed meat, red meat. Standard deviations for the scores are 1.82 for PC1 and 1.35 for PC2. The explained variance for component 1, 2, 3 and 4 are 12%, 7%, 5% and 5% respectively.

