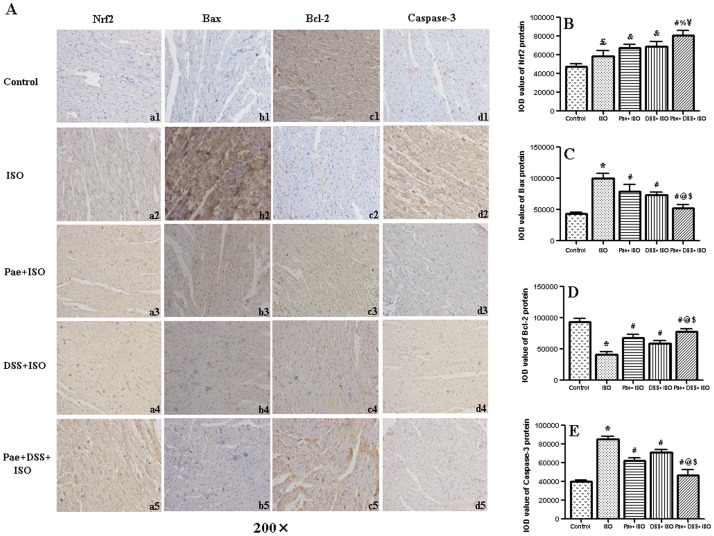
Figure 7. Graph A showing the representative immunohistochemical staining of Nrf2 (a1, a2, a3, a4 and a5), Bax (b1, b2, b3, b4 and b5), Bcl-2 (c1, c2, c3, b4 and c5) and Caspase-3 (d1, d2, d3, d4 and d5) expression in myocardium.
Control group (a1, b1, c1, and d1), ISO group (a2, b2, c2 and d2), Pae+ISO group (a3, b3, c3 and d3), DSS+ISO group (a4, b4, c4 and d4) and Pae+DSS+ISO group (a5, b5, c5 and d5). Bar graph B, C, D and E showing the levels of Nrf2, Bax, Bcl-2 and Caspase-3 protein in myocardium, respectively, expressed as the integral optical density (IOD). Values are expressed as mean ± S.D. (n = 5). ??? P<0.05 vs. Control, * P<0.001 vs. Control; & P<0.05 vs. ISO, # P<0.001 vs. ISO; % P<0.01 vs. Pae+ISO, @ P<0.001 vs. Pae+ISO; ¥ P<0.01 vs. DSS+ISO, $ P<0.001 vs. DSS+ISO (one-way ANOVA).

