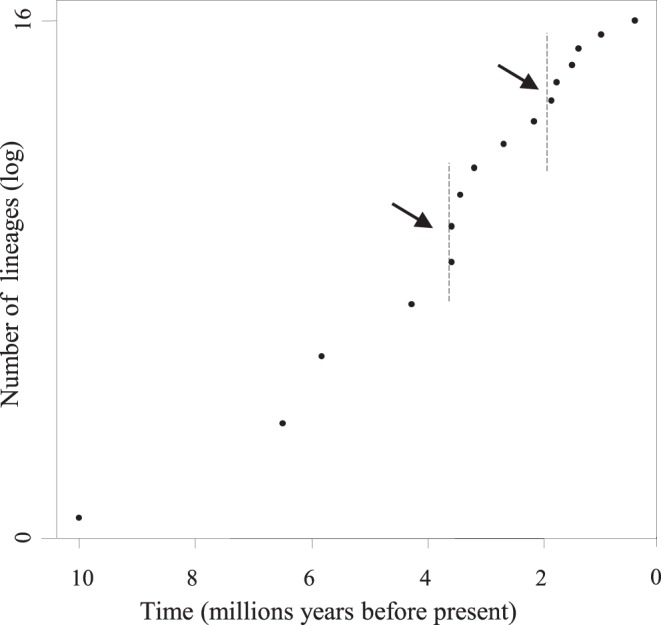
Figure 2. Species-level log lineages-through-time (LTT) plot for Agnotecous (excluding infra-specific data).

Two minor increases in diversification rates around 3.5 Ma and 2 Ma are showing, but likelihood analyses reject the null hypothesis that diversification rates in Agnotecous have been constant through time.
